


Our team has over 7,000,000 traders!
Every day we work together to improve trading. We get high results and move forward.
Recognition by millions of traders all over the world is the best appreciation of our work! You made your choice and we will do everything it takes to meet your expectations!
We are a great team together!
InstaSpot. Proud to work for you!


Actor, UFC 6 tournament champion and a true hero!
The man who made himself. The man that goes our way.
The secret behind Taktarov's success is constant movement towards the goal.
Reveal all the sides of your talent!
Discover, try, fail - but never stop!
InstaSpot. Your success story starts here!

The USD/JPY pair climbed as much as 138.87 level where it found resistance and now it has plunged. It was traded at 137.98 at the time of writing above 137.71 today's low. I've told you in my previous analysis that the pair could register sharp movements after the BOJ.
Technically, the bias remains bullish despite the current sell-off. The rate stands above strong downside obstacles. Today, the Bank of Japan maintained the BOJ Policy Rate unchanged at -0.10% as expected. In addition, the Trade Balance came in at -1.93T below -2.10T expected.
Fundamentally, the USD is sluggish in the short term after the Unemployment Claims indicator was reported at 251K versus 240K estimated. Also, the CB Leading Index and the Philly Fed Manufacturing Index came in worse than expected.
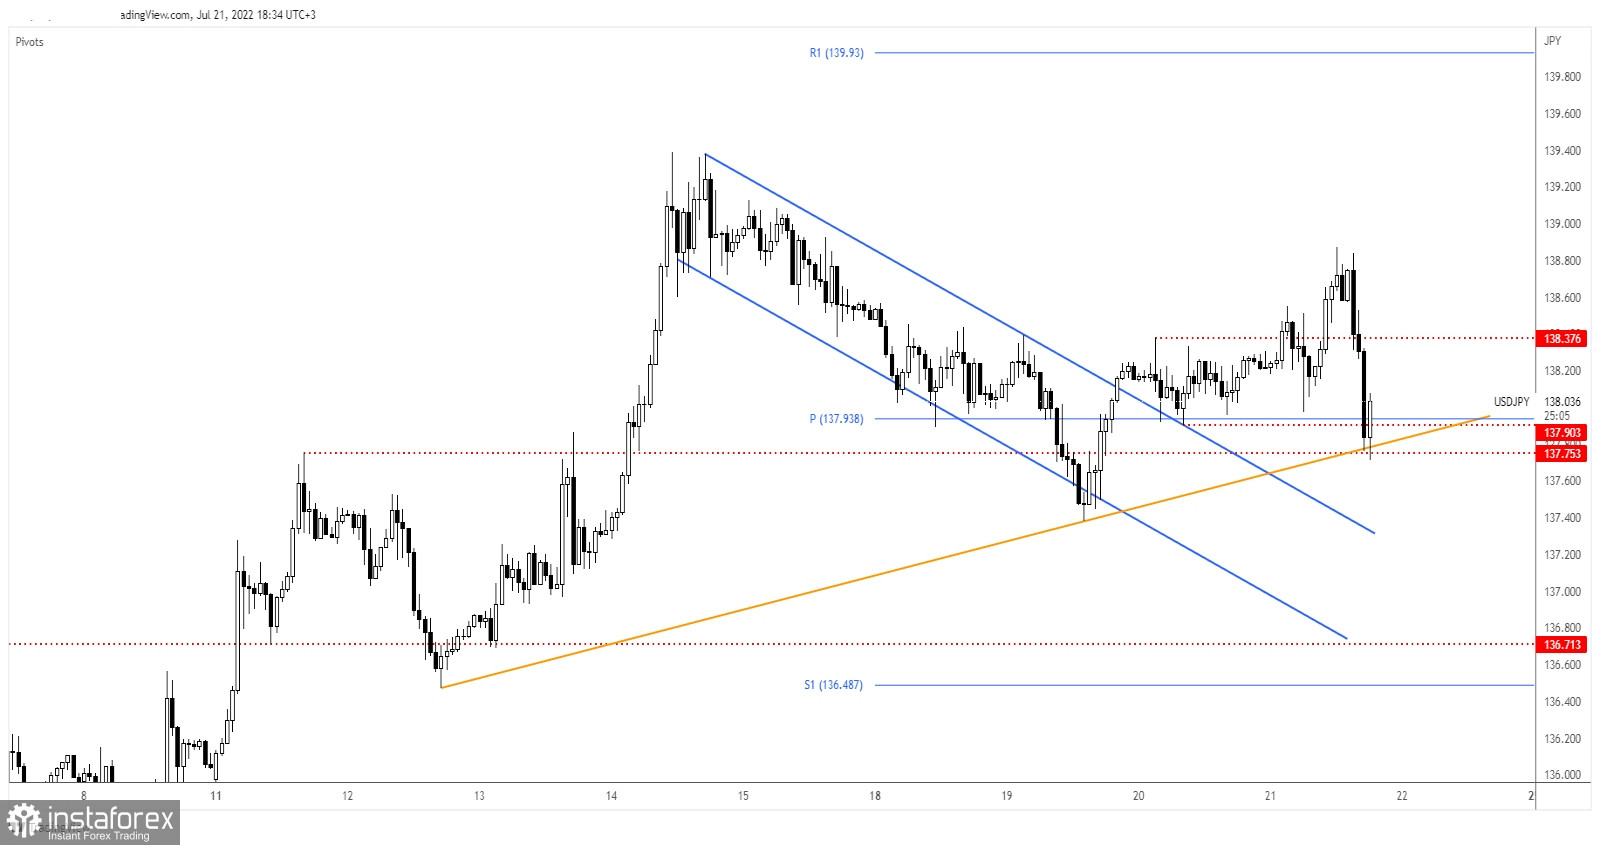
As you can see on the H1 chart, the rate failed to stay above the 138.37 key level and now it has challenged the uptrend line and the 137.75 which represent downside obstacles. As long as it stays above these levels, the USD/JPY pair could try to come back higher.
Only a valid breakdown of the near-term downside obstacles could open the door for a deeper drop. This scenario could take shape if the DXY drops deeper and if the Japanese Yen Futures will rebound.
A new lower low, a valid breakdown below 137.71 could activate more declines. This scenario could short signals. Still, as long as it stays above the uptrend line, we could look for long opportunities. False breakdowns (pin par) or a bullish pattern (bullish engulfing) could signal new bullish momentum.
*এখানে পোস্ট করা মার্কেট বিশ্লেষণ আপনার সচেতনতা বৃদ্ধির জন্য প্রদান করা হয়, ট্রেড করার নির্দেশনা প্রদানের জন্য প্রদান করা হয় না।
ইন্সটাফরেক্স বিশ্লেষণমূলক পর্যালোচনাগুলো আপনাকে মার্কেট প্রবণতা সম্পর্কে পুরোপুরি সচেতন করবে! ইন্সটাফরেক্সের একজন গ্রাহক হওয়ায়, দক্ষ ট্রেডিং এর জন্য আপনাকে অনেক সেবা বিনামূল্যে প্রদান করা হয়।


