


Our team has over 7,000,000 traders!
Every day we work together to improve trading. We get high results and move forward.
Recognition by millions of traders all over the world is the best appreciation of our work! You made your choice and we will do everything it takes to meet your expectations!
We are a great team together!
InstaSpot. Proud to work for you!


Actor, UFC 6 tournament champion and a true hero!
The man who made himself. The man that goes our way.
The secret behind Taktarov's success is constant movement towards the goal.
Reveal all the sides of your talent!
Discover, try, fail - but never stop!
InstaSpot. Your success story starts here!

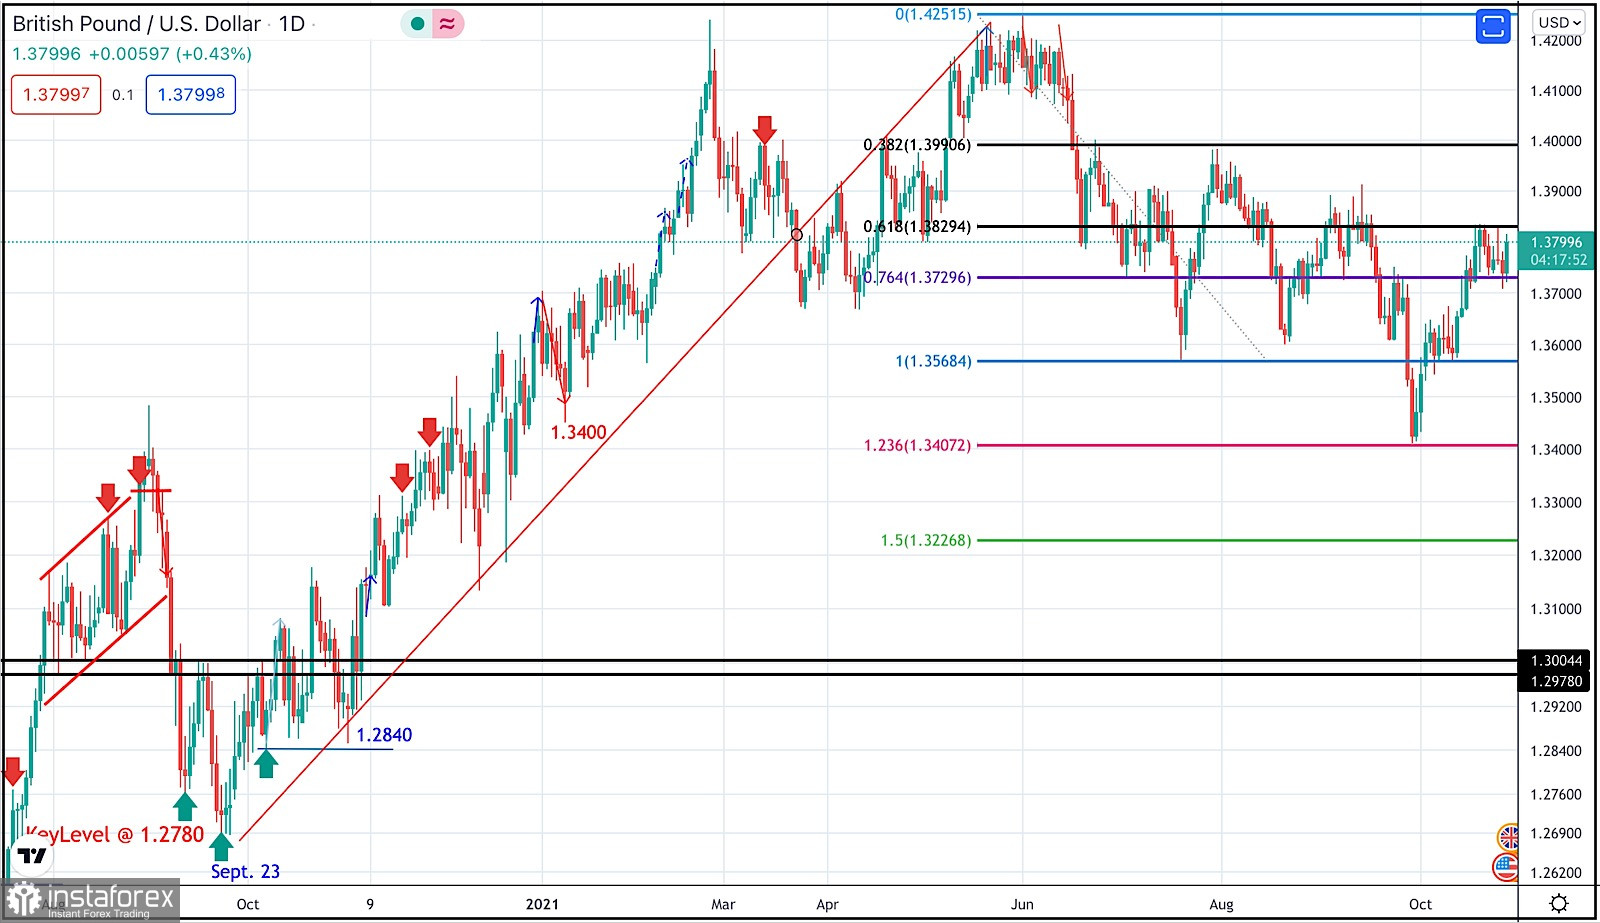
The GBPUSD pair has been moving sideways with some bearish tendency while bearish breakout below 1.3600 was needed to enhance further bearish decline.
On the other hand, the nearest SUPPLY level was located around 1.4000 where bearish rejection and a valid SELL Entry was anticipated.
The recent bullish rejection witnessed around 1.3600 as well as the temporary bullish breakout above 1.3880 indicated a high probability that this bullish movement may pursue towards 1.4025 then 1.4100.
However, the pair remained trapped within a fixed price range until significant bearish momentum emerged into the market.
Bearish breakout below 1.3720 enabled further bearish decline towards 1.3560 then 1.3400 which was expected to be reached.
Recently, the GBPUSD pair was testing Demand-Zone located around 1.3400 which corresponded to 123% Fibonacci Level of the most recent bearish movement.
This was a good entry level for a corrective bullish pullback towards 1.3650 and 1.3720 which was bypassed.
Currently, the short-term outlook remains bullish as long as the pair maintains its movement above 1.3730. However, the pair was testing the resistance zone around 1.3830 where some bearish pressure originiated into the market.
Bullish persistence above 1.3830 is needed to enable further bullish advancement towards the next Fibonacci Expansion level around 1.3990
On the other hand, another bearish decline below 1.3720 will probably be an indicator for more bearish movement towards 1.3570 as it corresponds to the next Fibonacci Expansion Level.
*এখানে পোস্ট করা মার্কেট বিশ্লেষণ আপনার সচেতনতা বৃদ্ধির জন্য প্রদান করা হয়, ট্রেড করার নির্দেশনা প্রদানের জন্য প্রদান করা হয় না।
ইন্সটাফরেক্স বিশ্লেষণমূলক পর্যালোচনাগুলো আপনাকে মার্কেট প্রবণতা সম্পর্কে পুরোপুরি সচেতন করবে! ইন্সটাফরেক্সের একজন গ্রাহক হওয়ায়, দক্ষ ট্রেডিং এর জন্য আপনাকে অনেক সেবা বিনামূল্যে প্রদান করা হয়।


