


Đội ngũ của chúng tôi có hơn 7,000,000 thương nhân!
Hàng ngày chúng tôi làm việc cùng nhau để cải thiện việc giao dịch. Chúng tôi nhận được kết quả cao và luôn tiến lên phía trước.
Sự công nhận của hàng triệu thương nhân trên toàn thế giới là sự đánh giá tốt nhất cho công việc của chúng tôi! Bạn đã đưa ra quyết định của mình và chúng tôi sẽ làm mọi thứ cần thiết để đáp ứng mong đợi của bạn!
Chúng ta cùng với nhau sẽ là một nhóm tuyệt vời!
InstaSpot. Tự hào làm việc cho bạn!


Diễn viên, nhà vô địch mùa giải UFC 6 và là người hùng thật sự!
Người tự mình làm nên tất cả. Người đàn ông đáng kể học hỏi.
Bí mật đằng sau thành công của Taktarov là sự cố gắng liên tục hướng tới mục tiêu.
Hãy khai phá tất cả các mặt tài năng của bạn!
Khám phá, thử, thất bại - nhưng không bao giờ dừng lại!
InstaSpot. Câu chuyện thành công của bạn bắt đầu từ đây!
The wave pattern on the 4-hour chart for EUR/USD has changed somewhat. There is still no discussion about canceling the upward trend segment (lower chart), which began in January of last year, but the overall structure has now taken on a corrective appearance. From a long-term perspective, a wave C formation can be expected, with its low likely positioned below the low of wave A. At the current stage, it is difficult to believe in such a strong decline in the euro, but the first quarter of 2026 demonstrated that geopolitics can dramatically reverse market trends.
On the lower timeframe, I can identify a classic three-wave upward corrective structure. Following the completion of this structure, a new downward trend segment began to form, which logically should take the shape of an impulse wave. If this assumption is correct, the market may develop a five-wave structure within wave C of the higher degree, with targets below the 1.1400 level. Are there sufficient fundamental reasons to expect such a strong strengthening of the dollar? In my opinion, currently there are not. Monday demonstrated that Tehran and Washington may return to the negotiating table, reducing the likelihood of further dollar appreciation.
The EUR/USD pair lost another 30 basis points during Thursday's trading, even before the start of the American session. Neither Monday nor Wednesday managed to force market participants to abandon euro selling in favor of the US dollar. Let me remind you that optimistic news regarding negotiations between Iran and the United States emerged on both Monday and Wednesday, but it is safe to say that Tuesday's and Thursday's developments erased all previous optimism — once again. The market continues to trade almost exclusively on geopolitical factors, which, as we have already established, shift direction almost daily. At present, the formation of wave 3 or wave c downward continues, but it has developed a clearly defined five-wave structure, meaning it may be completed in the near future around the 1.1578 level, corresponding to the 61.8% Fibonacci retracement level.
Today, the Eurozone PMI reports were released. Data showed that the services sector slowed from 47.6 to 46.4 points, while the manufacturing sector declined from 52.2 to 51.4 points. Therefore, it is reasonable to assume that today's euro selling was at least partly driven by economic data. It is important to remember that PMI indices are leading indicators of economic conditions. In other words, if the indices weaken in May, economic growth may also slow in the coming months — especially considering that eurozone growth has remained weak for several years. Based on this, the ECB may decide against raising interest rates in June, as policymakers must now consider not only inflation but also slowing economic activity. Like the Federal Reserve, the European regulator may find itself facing the difficult challenge of stagflation. The question now is which priority the ECB will choose.
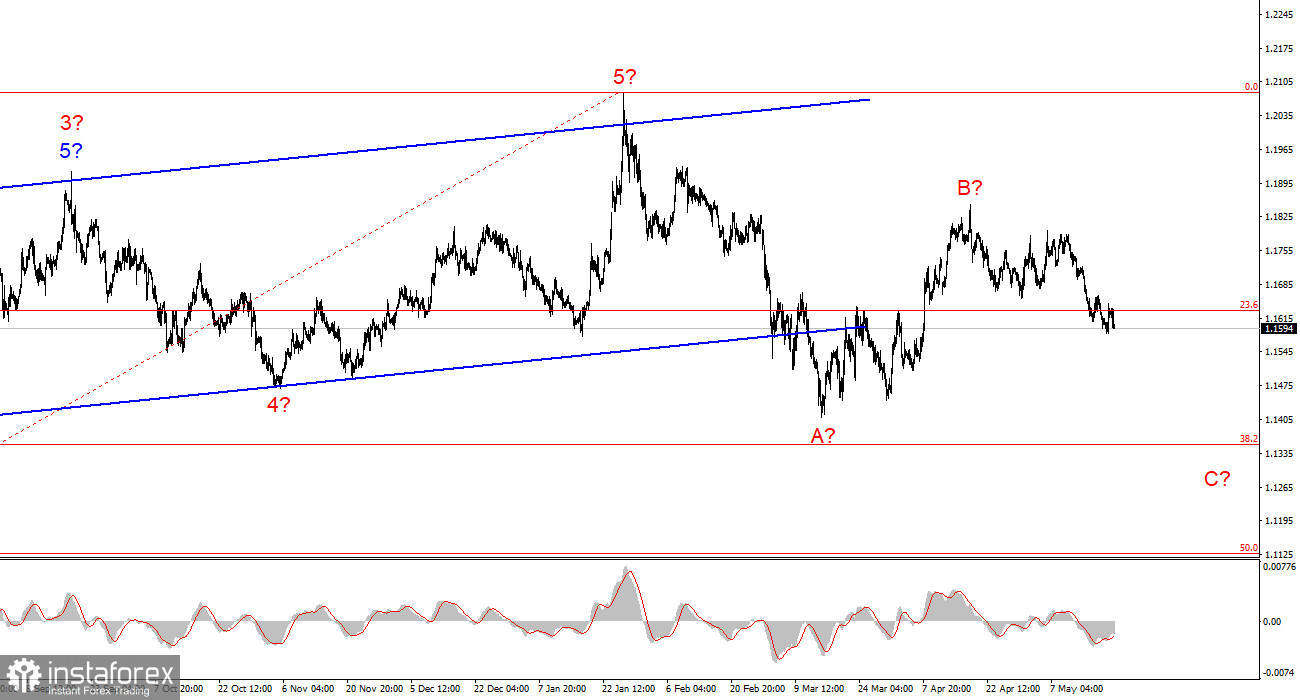
Based on the EUR/USD analysis, I conclude that the pair remains within a broader upward trend segment (lower chart), while in the shorter term it is moving within a corrective structure. The corrective a-b-c wave structure appears complete. Consequently, wave 3 or wave c continues to develop and may become part of a larger wave C. The entire wave C (if the current wave count is correct) could eventually complete far below the 1.1400 area. However, such a scenario would require strong geopolitical support. Otherwise, the current downward structure may instead form a simple a-b-c pattern and conclude near the 1.1578 level.
On the higher timeframe, an upward trend segment remains visible, followed by the formation of a corrective wave structure. In the near future, wave C may develop with targets around 1.1352, corresponding to the 38.2% Fibonacci retracement level. Once the A-B-C structure is completed, a new long-term upward trend may begin to form.
Key Principles of My Analysis:
*Phân tích thị trường được đăng tải ở đây có nghĩa là để gia tăng nhận thức của bạn, nhưng không đưa ra các chỉ dẫn để thực hiện một giao dịch.
InstaSpot analytical reviews will make you fully aware of market trends! Being an InstaSpot client, you are provided with a large number of free services for efficient trading.


