




Đội ngũ của chúng tôi có hơn 7,000,000 thương nhân!
Hàng ngày chúng tôi làm việc cùng nhau để cải thiện việc giao dịch. Chúng tôi nhận được kết quả cao và luôn tiến lên phía trước.
Sự công nhận của hàng triệu thương nhân trên toàn thế giới là sự đánh giá tốt nhất cho công việc của chúng tôi! Bạn đã đưa ra quyết định của mình và chúng tôi sẽ làm mọi thứ cần thiết để đáp ứng mong đợi của bạn!
Chúng ta cùng với nhau sẽ là một nhóm tuyệt vời!
InstaSpot. Tự hào làm việc cho bạn!





Diễn viên, nhà vô địch mùa giải UFC 6 và là người hùng thật sự!
Người tự mình làm nên tất cả. Người đàn ông đáng kể học hỏi.
Bí mật đằng sau thành công của Taktarov là sự cố gắng liên tục hướng tới mục tiêu.
Hãy khai phá tất cả các mặt tài năng của bạn!
Khám phá, thử, thất bại - nhưng không bao giờ dừng lại!
InstaSpot. Câu chuyện thành công của bạn bắt đầu từ đây!
Gold Technical Analysis
It appears that the price of gold is heading for further decline; let us examine the chart indicators that lead to this forecast.
Daily Chart
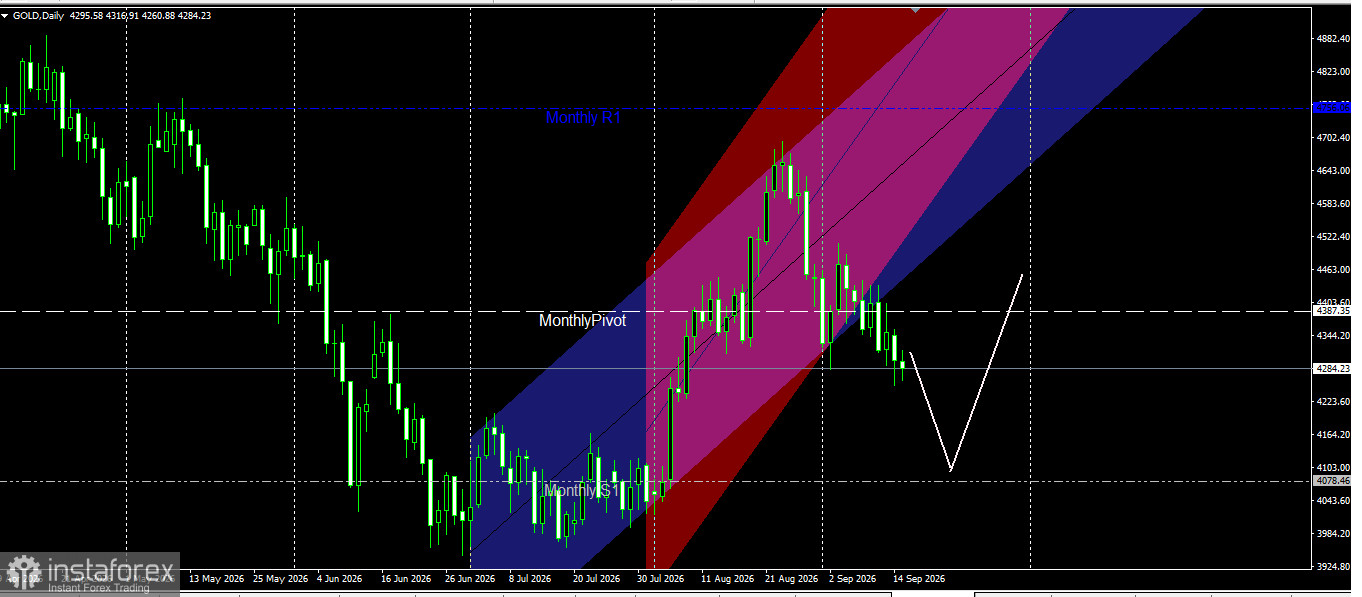
On the daily chart, the gold price had been trading within rising price channels representing the trend over the past two months, finding support at the monthly pivot level of 4387.35.
Subsequently, the price encountered resistance at the channel midlines and began to decline, successfully breaking below both the price channels and the monthly pivot level.
Consequently, on the daily chart, the gold price is expected to move toward the monthly support level of 4078.46—a critical level.
Either the price will find support here to resume the uptrend and target the 4387.35 level,
Or this support will be broken, leading to a target at the annual support level of 3830.
This brings us to the weekly chart:
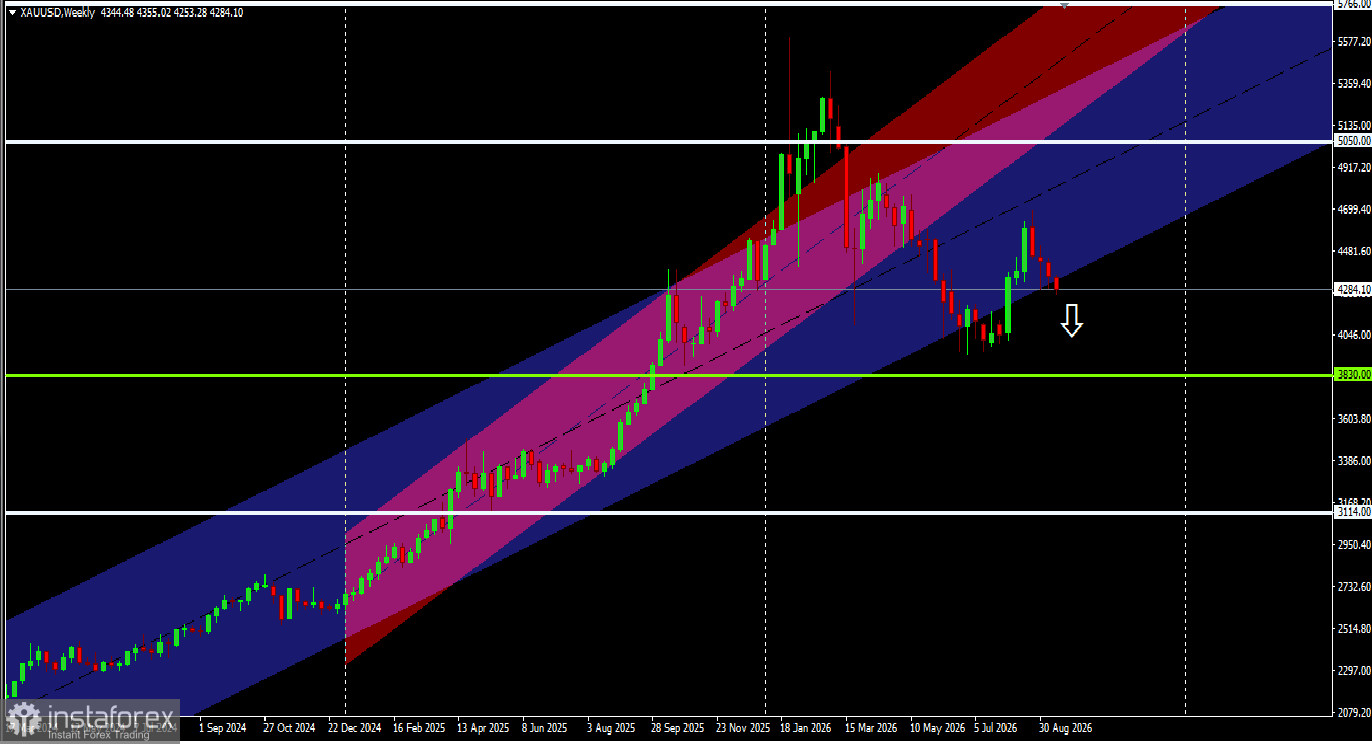
On the weekly chart, the gold price has successfully broken below the rising price channels that defined the trend over the previous two years.
However, a similar breakout occurred previously, and the annual pivot zone at 3830 succeeded in pushing the price back up.
Will this price action repeat itself, with gold finding support at the 3830 level? This is what needs to be monitored.
The trading recommendation is to focus on selling opportunities as long as the price trades below the 4387.00 and 4078.00 levels.
Buying is an option if bullish price action emerges at the 4078.00 support level.
Buying is also possible above the 4387 level.
*Phân tích thị trường được đăng tải ở đây có nghĩa là để gia tăng nhận thức của bạn, nhưng không đưa ra các chỉ dẫn để thực hiện một giao dịch.
InstaSpot analytical reviews will make you fully aware of market trends! Being an InstaSpot client, you are provided with a large number of free services for efficient trading.


