


GBP/USD
Analysis:
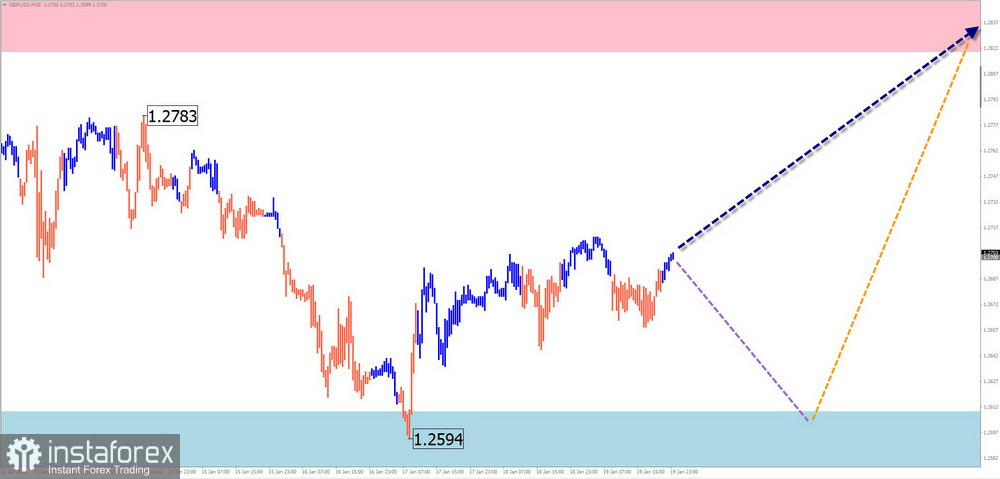
The last unfinished wave structure on the British pound's chart today is descending. The wave started in November last year and appears as a horizontal flat. In the structure of a larger wave, this segment serves as a correction. Quotes have formed a flat corridor between potential reversal zones of different levels.
Forecast:
In the coming week, there is likely to be a continuation of the British pound's upward price movement. Initially, a brief decline in support levels is not excluded. The highest volatility is expected closer to the weekend.
Potential Reversal Zones
Resistance:
Support:
Recommendations:
Sales: No conditions exist for such transactions in the pair's market.
Purchases: These deals may be used in trading after reversal signals appear in the support zone on your trading systems.
AUD/USD
Analysis:
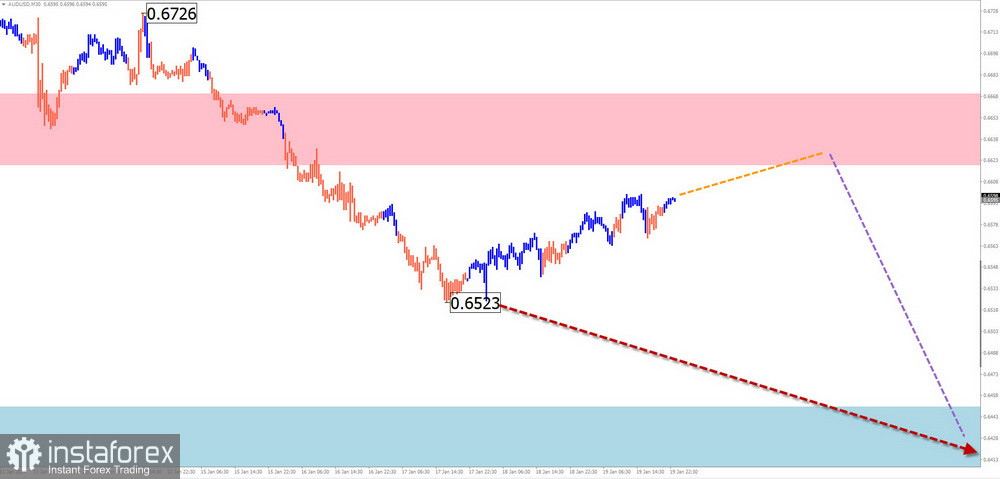
The ascending wave of the Australian dollar since October 13th of the previous year brought the quotes to a powerful potential reversal zone of a large-scale chart. In the wave structure, a flat correction in the form of a shifting flat has developed over the last two months. In the structure of this wave model, the final part is missing.
Forecast:
Throughout the current week, a continuation of the overall downward movement of the pair is expected. After a probable attempt to pressure the resistance zone, a change in direction and a decline to the support area can be expected.
Potential Reversal Zones
Resistance:
Support:
Recommendations:
Purchases: Similar deals are risky and may result in losses.
Sales: Sales carry an elevated level of risk until confirmed reversal signals appear on your trading systems.
USD/CHF
Analysis:
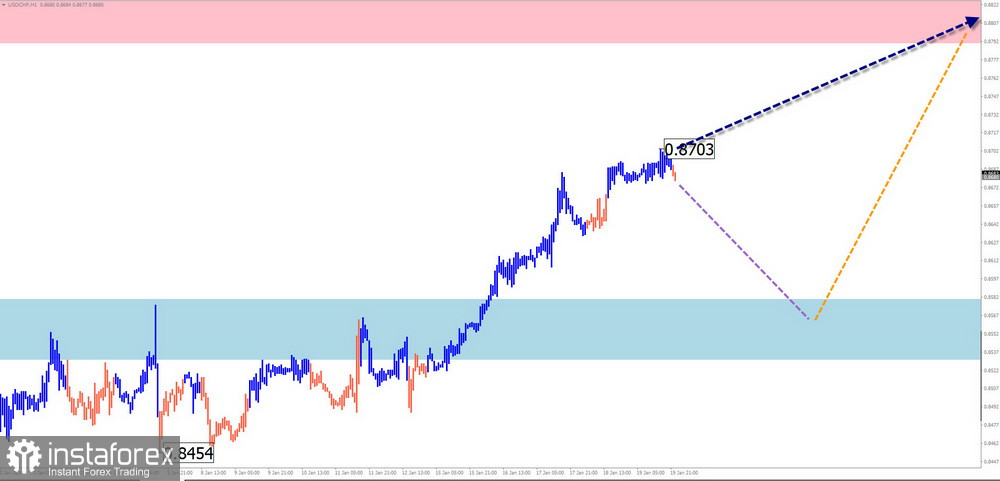
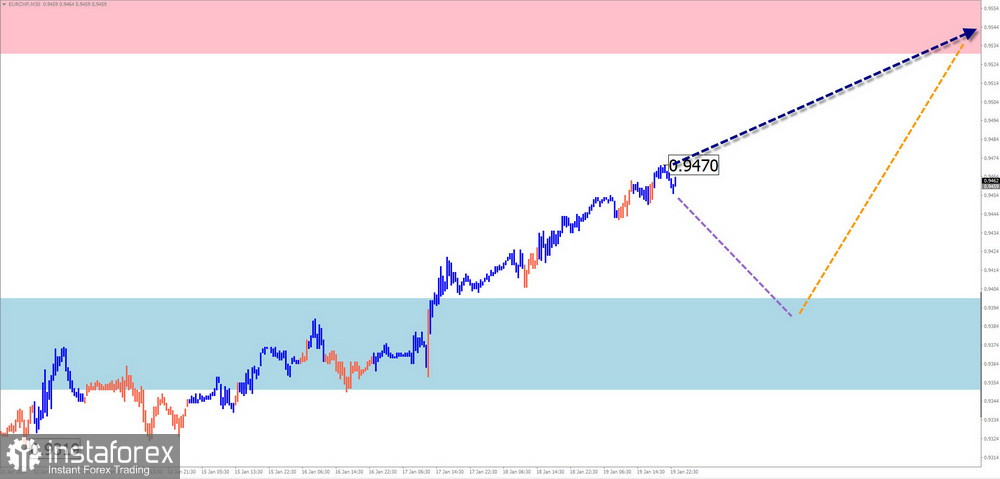
The direction of short-term movements of the Swiss franc since late December of the previous year is set by an ascending wave algorithm. The wave has reversal potential. Its wave level exceeded the H4 timeframe scale. The price broke through the intermediate resistance zone. In the structure, the need for correction has become apparent.
Forecast:
In the first few days of the week, a weak downward movement with a decrease in the exchange rate to the support boundaries can be expected. Subsequently, a reversal and a resumption of the price movement upwards can be anticipated. The calculated resistance is located at the lower boundary of the preliminary target zone of the entire current wave.
Potential Reversal Zones
Resistance:
Support:
Recommendations:
Sales: Sales with fractional volumes may become possible during separate sessions.
Purchases: They will become relevant only after reversal signals appear in your trading systems within the resistance zone.
EUR/JPY
Analysis:
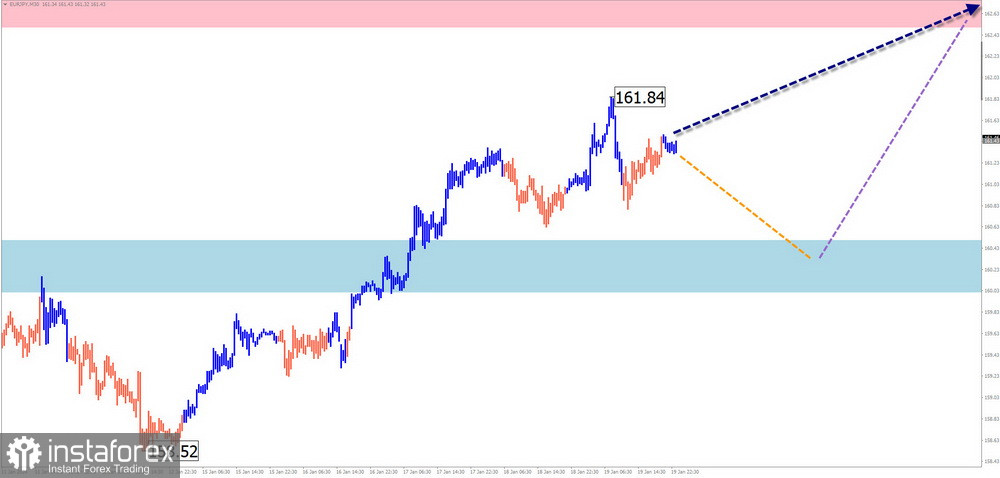
The direction of short-term movements of the EUR/JPY pair since December of the previous year is set by an ascending wave. This segment coincides with the global trend. On the chart, the wave appears as a pennant that is not completed at the time of analysis.
Forecast:
In the upcoming week, a continuation of the overall upward trend is expected. After possible pressure on the support zone, a reversal and a resumption of the price movement upwards can be expected. The calculated resistance runs along the upper boundary of the preliminary calculated zone of the entire current wave.
Potential Reversal Zones
Resistance:
Support:
Recommendations:
Sales: Such transactions may be risky due to the small potential for an expected decline.
Purchases: They will become relevant only after reversal signals appear within the resistance zone on your trading systems.
EUR/CHF
Analysis:
The direction of the price movement of the EUR/CHF pair since the beginning of last year is determined by a descending trend. The last unfinished wave segment on the chart at the time of analysis is directed upwards. Its potential does not exceed the level of correction of the last part of the main wave.
Forecast:
In the first couple of days, a sideways flat or a brief decline no lower than the calculated support is possible. A resumption of the upward price movement is more likely by the end of the week. The calculated resistance demonstrates the lower boundary of the preliminary target zone of the entire current wave.
Potential Reversal Zones
Resistance:
Support:
Recommendations:
Sales: They are high-risk and may lead to a loss of deposit.
Purchases: They may be used in trading after corresponding reversal signals appear in the resistance zone on your trading systems.
US dollar index
Brief Analysis:
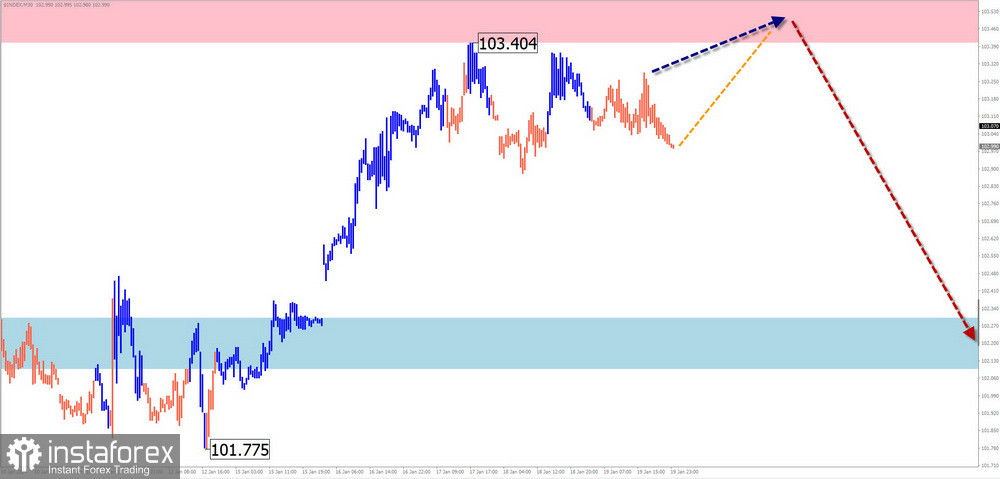
After a period of active decline, the US dollar index is experiencing a correction. The wave counts from mid-December of the previous year still need to be completed. Since the beginning of this year, the index's quotes have drifted, forming an intermediate retracement. The preliminary target zone coincides with the strong support of the largest timeframe of the chart.
Weekly Forecast:
At the beginning of the upcoming week, the index's likelihood of a sideways price movement along the resistance zone remains. By the end of the week, an increase in volatility, a reversal, and a resumption of the decline cannot be ruled out.
Potential Reversal Zones
Resistance:
Support:
Recommendations:
Conditions for selling the US currency on the market are risky. The weakening of the US dollar has limited potential. Transactions to weaken the positions of national currencies in major pairs may yield profits.
Explanation: In simplified wave analysis (SWA), all waves consist of three parts (A-B-C). Only the last unfinished wave is analyzed in each timeframe. Dashed lines indicate expected movements.
Note: Wave analysis does not consider the duration of instrument movements in time!
*Phân tích thị trường được đăng tải ở đây có nghĩa là để gia tăng nhận thức của bạn, nhưng không đưa ra các chỉ dẫn để thực hiện một giao dịch.
InstaSpot analytical reviews will make you fully aware of market trends! Being an InstaSpot client, you are provided with a large number of free services for efficient trading.


