


EUR/USD
Analysis:
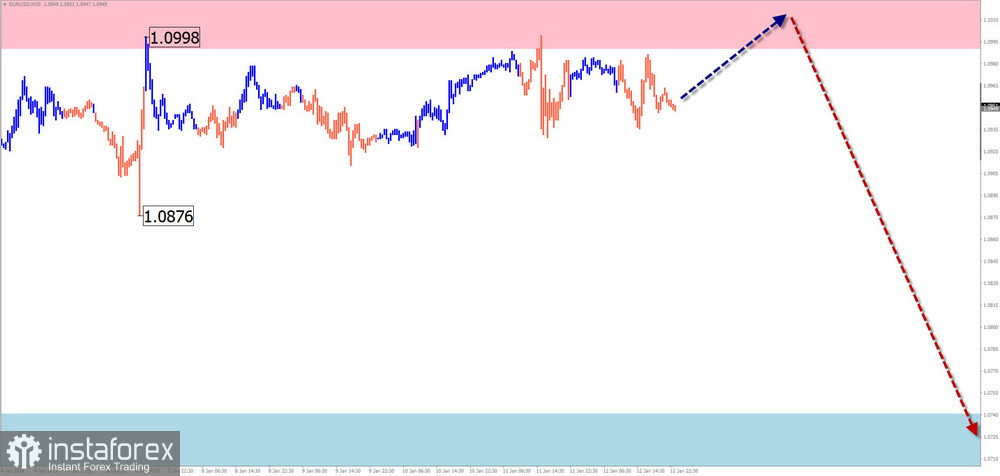
A corrective flat is still forming at the end of the bullish wave of the major European currency that began last year. The final segment is developing within its structure. At the time of analysis, the wave level of the opposing segments is insufficient to initiate a reversal.
Forecast:
In the coming days, we can expect the continuation of the sideways movement. After a likely attempt to pressure the resistance zone, we can anticipate a change in direction and a move towards the support zone. When changing direction, a brief breakthrough of the upper boundary of the resistance zone cannot be ruled out.
Potential Reversal Zones
Resistance:
Support:
Recommendations:
Purchases: Are quite risky and can lead to deposit losses.
Sales: This will be possible after confirmed reversal signals in the resistance area, per your chosen trading system.
USD/JPY
Analysis:
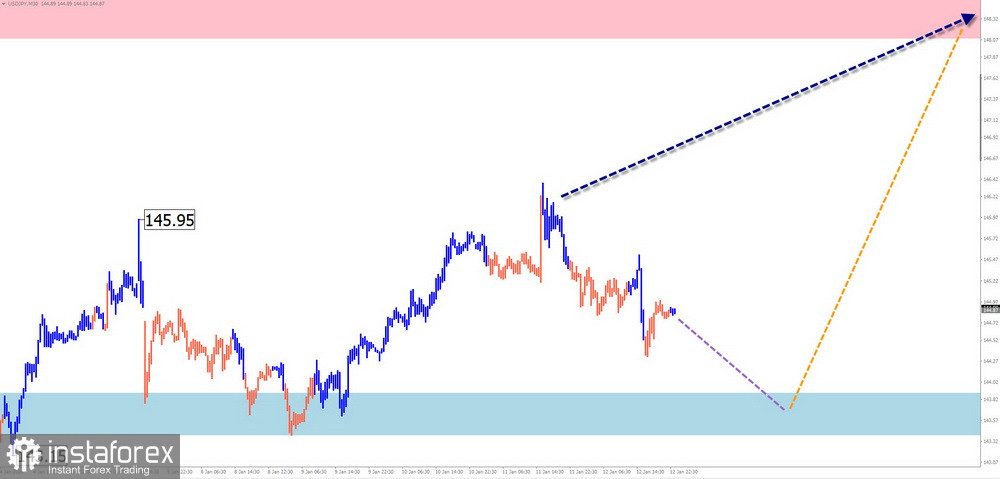
Since November of last year, the quotes of the Japanese yen have been moving downwards. The pressure in recent weeks has broken through the lower boundary of a strong support level on a large time frame, leading to a price rebound upwards. Before continuing the price decline, the correction phase must be completed.
Forecast:
The overall bullish price movement is likely to continue in the coming week. Before that, a short-term decrease in the support zone is possible. The resistance zone represents the upper boundary of the preliminary weekly price movement.
Potential Reversal Zones
Resistance:
Support:
Recommendations:
Sales: Are quite risky and can lead to deposit losses.
Purchases: This can be used with a small lot size to generate profits after confirmed reversal signals.
GBP/JPY
Analysis:
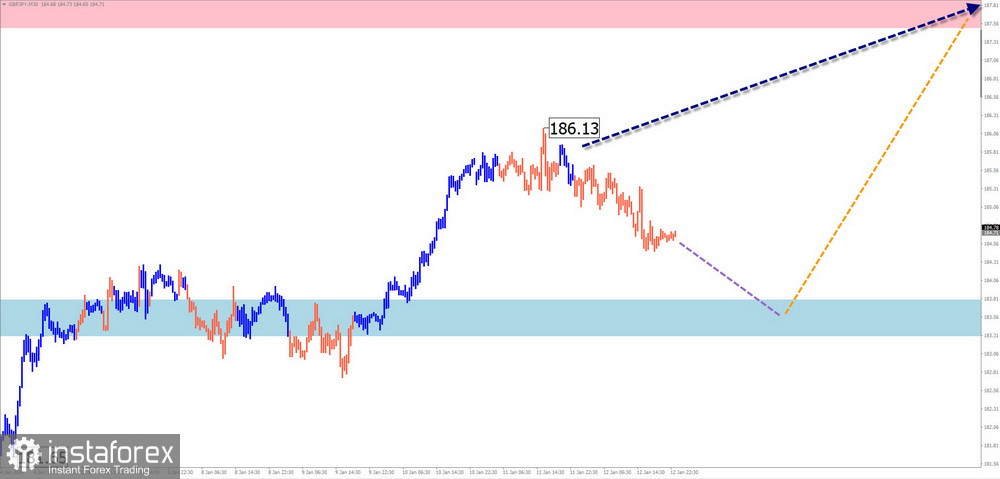
On the chart of the GBP/JPY pair, the direction of the short-term trend is determined by the bullish wave starting from December 7th of last year. This movement segment has reversal potential, extending beyond the correction of the previous wave. Currently, the price is forming an intermediate retracement.
Forecast:
This week, we can expect the continuation of the upward price movement. A decrease in pressure on the support zone is possible in the next few days. A reversal and resumption of the upward price movement are more likely towards the end of the week.
Potential Reversal Zones
Resistance:
Support:
Recommendations:
Sales: No market conditions for such transactions are present in the cross-market.
Purchases: Can be used in trading after appropriate reversal signals appear in the support area.
USD/CAD
Analysis:
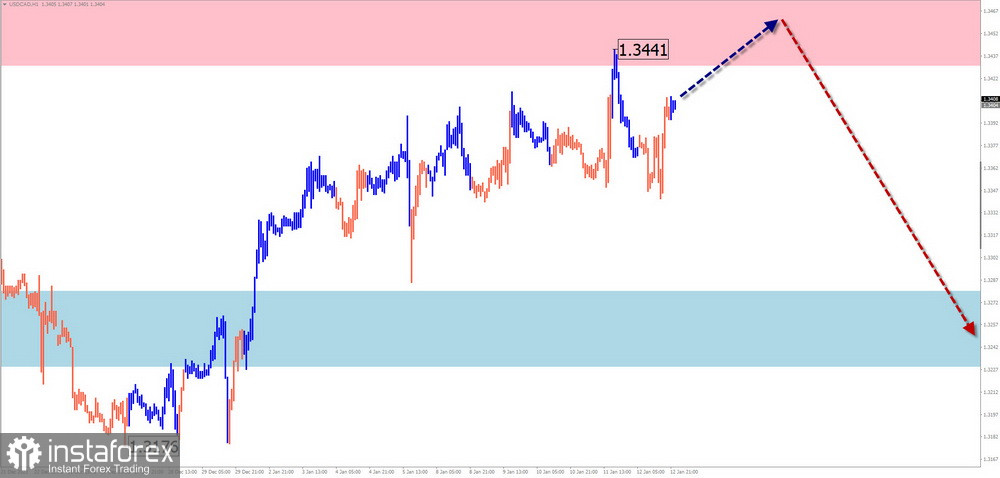
The direction of price fluctuations in the major Canadian dollar pair since November of last year is determined by a descending wave. Towards the end of the year, a wave structure is developing within the boundaries of a correction. Quotes are at the lower boundary of a powerful potential reversal zone.
Forecast:
In the coming week, there is a high probability of maintaining the overall sideways direction of price fluctuations. Pressure on the resistance zone can be expected in the first few days. With a high probability, a reversal and resumption of the decline can be further counted down to the support area.
Potential Reversal Zones
Resistance:
Support:
Recommendations:
Purchases: Have low potential and carry a high level of risk.
Sales: This will be possible after the appearance of appropriate reversal signals in the support area, as per your chosen trading system.
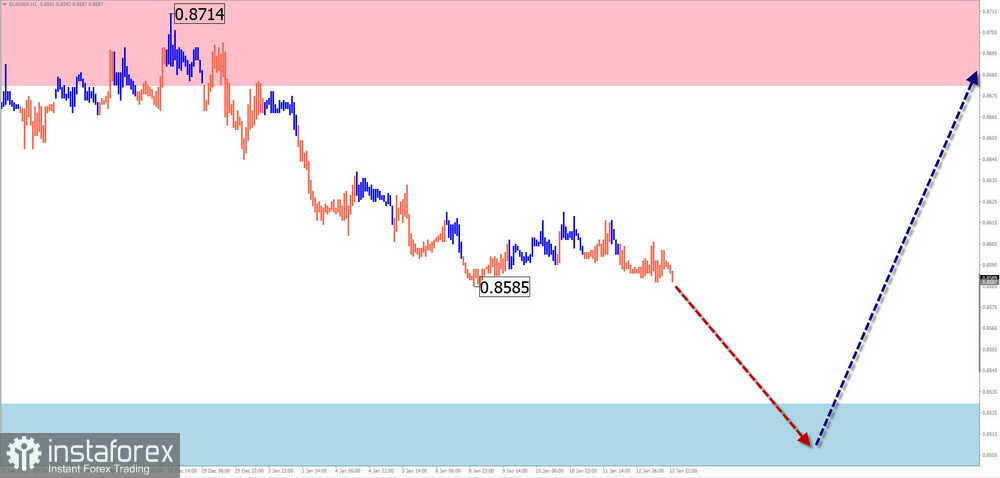
EUR/GBP
Analysis:
The current wave structure on the EUR/GBP cross chart dates back to the beginning of February last year. Since June, quotes have been drifting sideways, forming a correction (Wave B) that still needs to be completed. Cross rates are trapped in a narrow corridor between powerful potential reversal zones on the daily time frame.
Forecast:
In the coming days, we can expect the continuation of the downward price movement. The price is expected to form a reversal in the support zone and begin moving upwards. The highest activity is likely to occur closer to the weekend.
Potential Reversal Zones
Resistance:
Support:
Recommendations:
Sales: Fractional lots may be used in individual sessions. The support zone limits the potential.
Purchases: These are only feasible once the support zone appears.
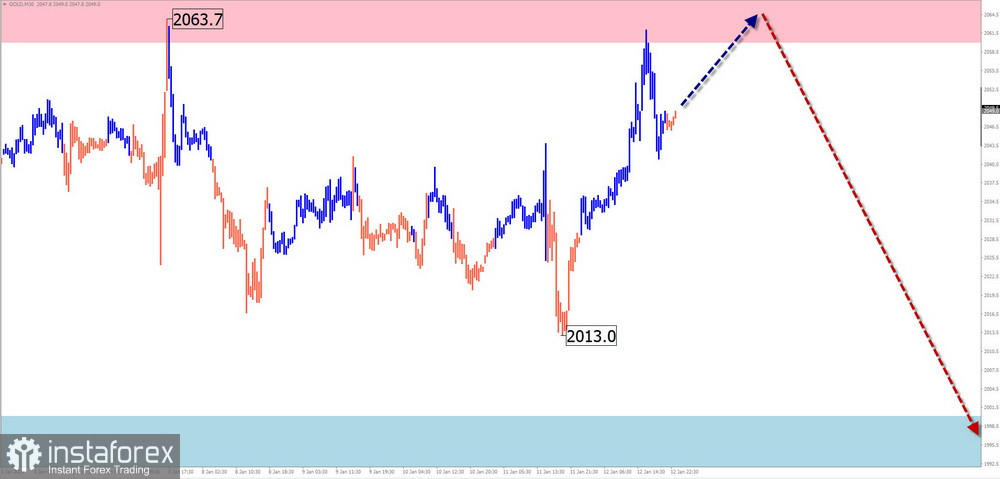
Gold
Analysis:
A downward wave has developed on the gold chart in the chaos of sideways movements since December last year. On a larger wave structure, this segment is forming a correction. Lines drawn between extremes on the pair's chart show a "horizontal pennant" pattern that is not yet completed at the time of analysis.
Forecast:
In the coming week, there is a high probability of maintaining the overall sideways direction of price fluctuations. Pressure on the resistance zone can be expected in the first few days. With a high probability, a reversal and a start of a decline can be expected further. The calculated support limits the expected range of the downward price movement.
Potential Reversal Zones
Resistance:
Support:
Recommendations:
Purchases: Have low potential and carry a high level of risk.
Sales: This will be possible after the appearance of appropriate reversal signals in the support area, as per your chosen trading system.
Explanations: In simplified wave analysis (SWA), all waves consist of 3 parts (A-B-C). The analysis focuses on the latest unfinished wave in each timeframe. Dashed lines indicate expected movements.
Note: The wave algorithm does not consider the duration of instrument movements in time!
*Phân tích thị trường được đăng tải ở đây có nghĩa là để gia tăng nhận thức của bạn, nhưng không đưa ra các chỉ dẫn để thực hiện một giao dịch.
InstaSpot analytical reviews will make you fully aware of market trends! Being an InstaSpot client, you are provided with a large number of free services for efficient trading.


