


EUR/USD
Analysis:
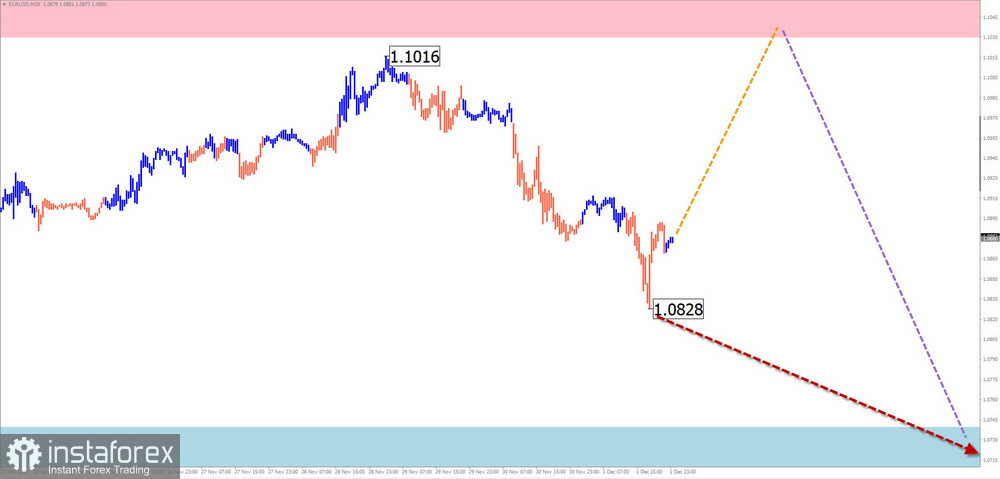
The analysis of the European currency chart shows that the bearish wave that started in July of the current year continues its formation. The wave level of the bullish structure that started at the end of September exceeded the retracement level of the previous trend segment. The wave structure is approaching the completion of the middle part (B). Last week, the price bounced down from the resistance zone.
Forecast:
At the beginning of the upcoming week, there is a high probability of a sideways movement for the euro. A price increase to the calculated resistance is expected in the first few days. Increased volatility and a return to a bearish trend can be anticipated by the end of the week.
Potential Reversal Zones
Resistance:
Support:
Recommendations:
Selling: There will be no trading conditions until reversal signals appear in the resistance zone.
Buying: This can be used for trading deals within the intraday with fractional lots.
USD/JPY
Analysis:
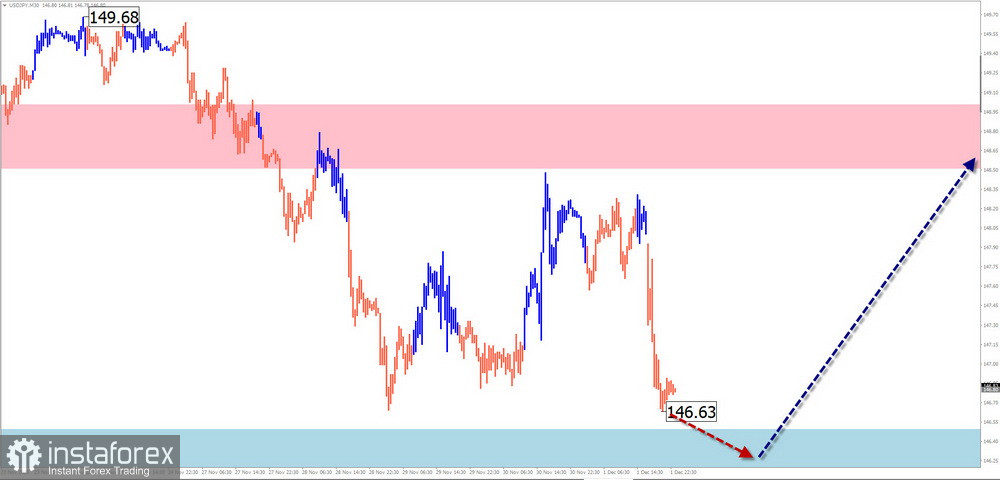
The direction of the short-term trend of the major pair of the Japanese yen is determined by the algorithm of an unfinished descending extended plane. The final part (C) is approaching completion in the wave structure. This entire segment on the daily chart forms a correction to the previous upward segment.
Forecast:
During the current week, the completion of the current decline is expected, as a reversal in the calculated support zone is formed and the beginning of an upward price movement. The calculated reversal zones demonstrate the expected weekly range of the pair's movement.
Potential Reversal Zones
Resistance:
Support:
Recommendations:
Buying: Quite risky. It can be used with fractional lots after the appearance of reversal signals.
Selling: Possible within intraday with reduced lots. In transactions, consider the limited potential for price decline.
GBP/JPY
Analysis:
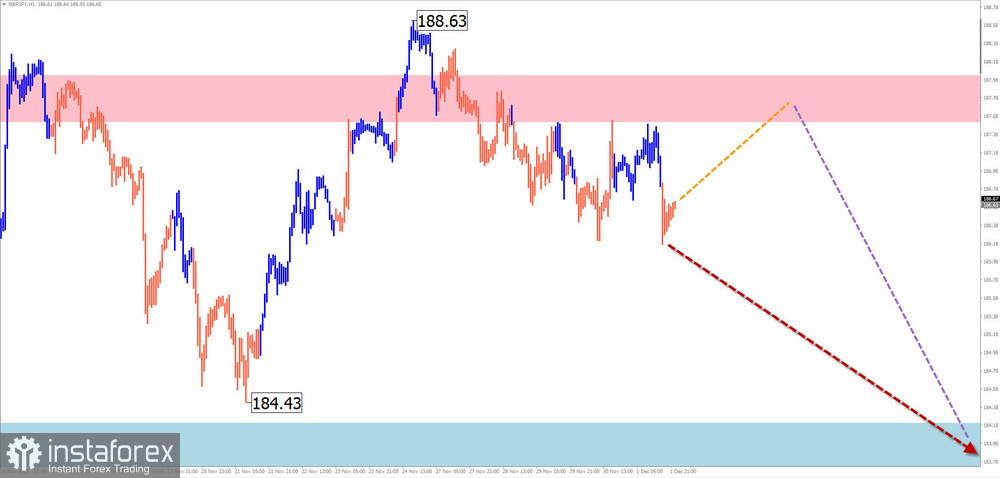
The ongoing upward trend in the British pound against the Japanese yen has been in progress since July 28th. Over the past months, quotes have mostly moved in a sideways plane, forming a correctional part (B). The wave is in the final phase of its formation.
Forecast:
A general downward vector of the cross movement is expected in the coming week. A decline can be expected up to the boundaries of the calculated support. In the next couple of days, a short-term rollback is not excluded, not higher than the resistance zone.
Potential Reversal Zones
Resistance:
Support:
Recommendations:
Buying: Premature until the completion of the current wave, and may lead to deposit losses.
Selling: Permissible within individual trading sessions with fractional lots.
USD/CAD
Analysis:
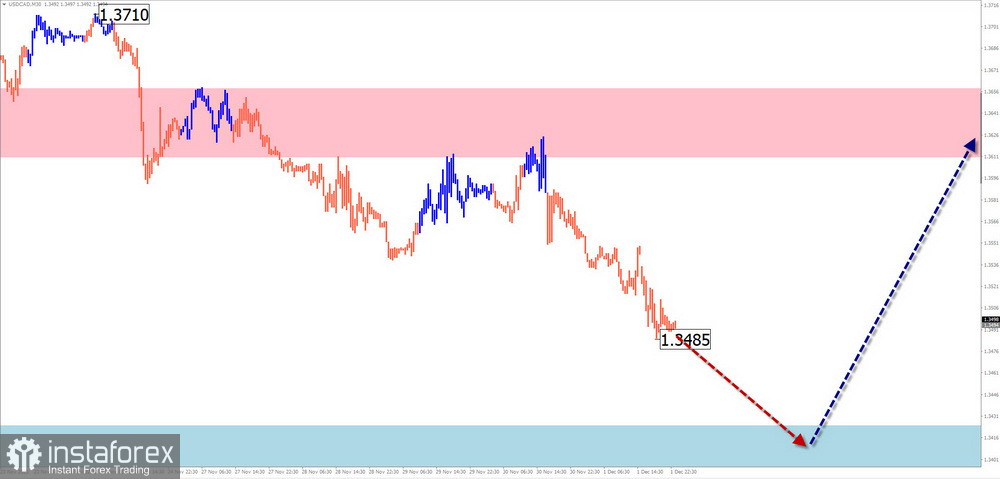
The direction of the price movement of the Canadian dollar in the main pair is set by the algorithm of an unfinished bullish wave from July 14th. In the last two months, the price on the chart forms a correction in the form of an extended plane. The structure of this wave lacks a final segment.
Forecast:
After probable pressure on the support zone in the next few days, the pair's price expects a reversal and a resumption of the upward trend. A brief penetration of the lower boundary of the support zone is not excluded when changing direction. The calculated resistance limits the upward range.
Potential Reversal Zones
Resistance:
Support:
Recommendations:
Buying: In the next few days, it has no potential.
Selling: Fractional lots from the resistance zone within individual sessions can be used.
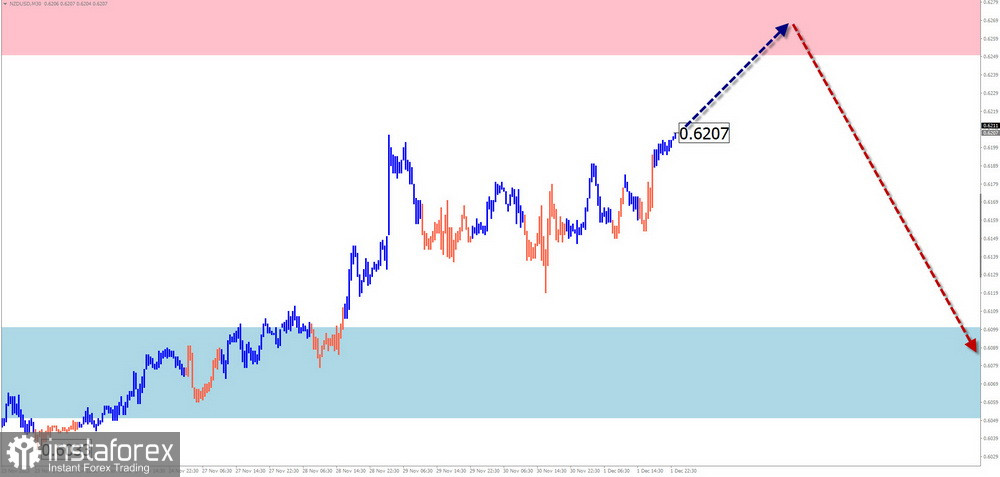
NZD/USD
Brief Analysis:
The trend direction of the major pair of the New Zealand dollar since September of last year sets an ascending wave zigzag of the weekly TF. Since the end of October, an ascending segment with reversal potential has been developing from a strong reversal zone. Upon confirmation in the form of a formed correction, it will start the final part (C) of the main wave.
Weekly Forecast:
In the upcoming weekly period, price movement is expected within the corridor between the nearest areas in opposite directions. Initially, an upward vector can be expected. A change in direction and a rollback to the support zone are likely by the end of the current or the next week.
Potential Reversal Zones
Resistance:
Support:
Recommendations:
Buying: Possible within intraday with fractional lots, having limited potential.
Selling: Unpromising until confirmed reversal signals appear near the resistance zone.
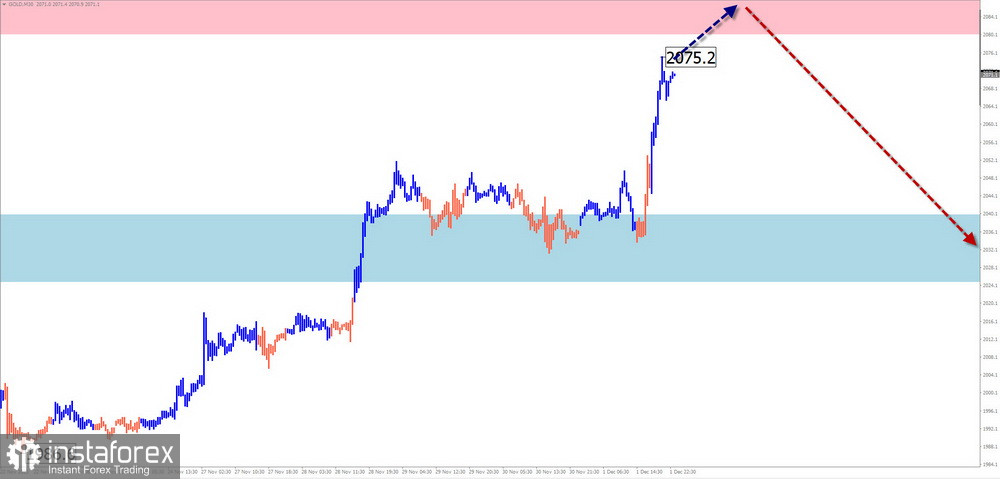
Gold
Analysis:
Gold quotes are approaching the maximum peak values of three years ago. The analysis of the unfinished wave structure from October 6th shows the formation of the final part (C). The lower boundary of a powerful potential reversal zone passes in the area of the calculated resistance.
Forecast:
An attempt to exert pressure on the resistance zone can be expected in the next couple of days. Then, with a high probability, a change in direction and the beginning of a decline can be counted up to the boundaries of the calculated support. The greatest volatility is expected by the end of the week.
Potential Reversal Zones
Resistance:
Support:
Recommendations:
Buying: Has a low potential and is quite risky.
Selling: This can be used in short-term trading within individual sessions only after the appearance of corresponding reversal signals near the resistance zone.
Notes: In simplified wave analysis (SWA), all waves consist of 3 parts (A-B-C). The latest, unfinished wave is analyzed at each TF. Dashed lines indicate expected movements.
Attention: The wave algorithm does not consider the duration of instrument movements over time!
*Phân tích thị trường được đăng tải ở đây có nghĩa là để gia tăng nhận thức của bạn, nhưng không đưa ra các chỉ dẫn để thực hiện một giao dịch.
InstaSpot analytical reviews will make you fully aware of market trends! Being an InstaSpot client, you are provided with a large number of free services for efficient trading.


