


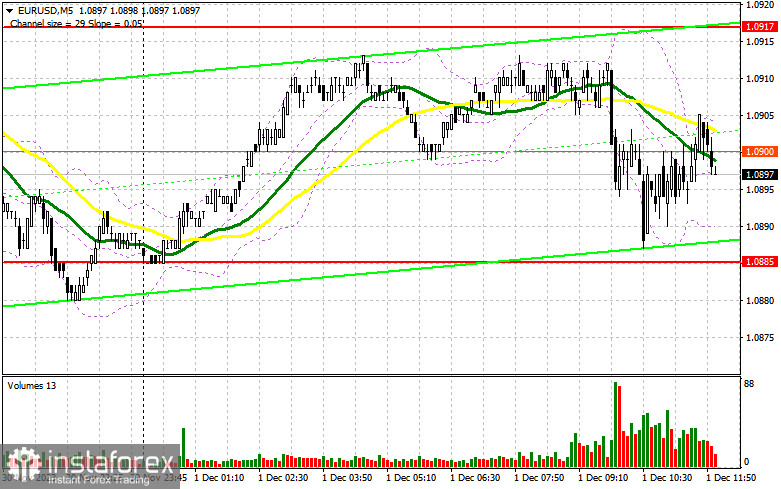
In my morning forecast, I highlighted the level of 1.0885 and recommended making decisions on market entry based on it. Let's look at the 5-minute chart and analyze what happened there. The pair experienced a decline, but due to the low volatility that we have become accustomed to seeing in the first half of the day lately, a false breakout did not occur. The technical picture for the second half of the day remained unchanged.
To open long positions on EUR/USD, the following is required:
The released PMI data for the Eurozone countries showed a slight recovery but remained below the 50-point level, indicating a contraction in activity. The euro reacted modestly. Although it held the daily minimum after the data – that's good. Since I did not reconsider the technical picture for the second half of the day, I plan to act according to the morning scenario. We have similar data from the United States ahead, and Federal Reserve Chairman Jerome Powell is also speaking. If he confirms a soft approach to future policy, we can expect a recovery in the euro and an upward correction at the end of the week. If the position remains unchanged, the pressure on the euro will increase. For this reason, I left the purchases until a proper test of support at 1.0885, which we did not do in the first half of the day. Only a false breakout formation will provide an entry point for long positions with the expectation of EUR/USD growth and a test of the new resistance at 1.0917 formed at the end of yesterday. Its breakout and updating from top to bottom will depend on Powell's statements, signaling a buy and a chance to refresh to 1.0947, where the moving averages supporting the sellers are located. The ultimate target will be the area of 1.0979, where I will make profits. With a further decline in EUR/USD and no activity at 1.0885 in the second half of the day, trading will move within the framework of a new descending channel, creating even more problems for buyers. In this case, I will enter the market only after forming a false breakout around 1.0857. I will open long positions immediately on the rebound from 1.0827, with a target of an ascending correction within the day by 30-35 points.
To open short positions on EUR/USD, the following is required:
Sellers remain in the market, but there are not enough fundamental reasons for increasing short positions in the current bullish market to continue the decline in the euro. Only the formation of a false breakout at 1.0917 after strong US data will give an excellent sell signal in anticipation of building a new bearish market. The nearest target is support at 1.0885. Only after breaking and consolidating below this range and a bottom-up retest do I expect to receive another sell signal with an exit to 1.0857. The ultimate target will be a minimum of 1.0827, where I will take profits. In the event of an upward movement in EUR/USD during the American session against the backdrop of Powell's soft statements, despite yesterday's inflation and the absence of bears at 1.0917, buyers will try to stop the correction and restore balance to the market. This will open the way for buyers to a maximum of 1.0947. You can sell there, but only after an unsuccessful consolidation. I will open short positions immediately on the rebound from 1.0979, with a target of a descending correction by 30-35 points.
Indicator Signals:
Moving Averages:
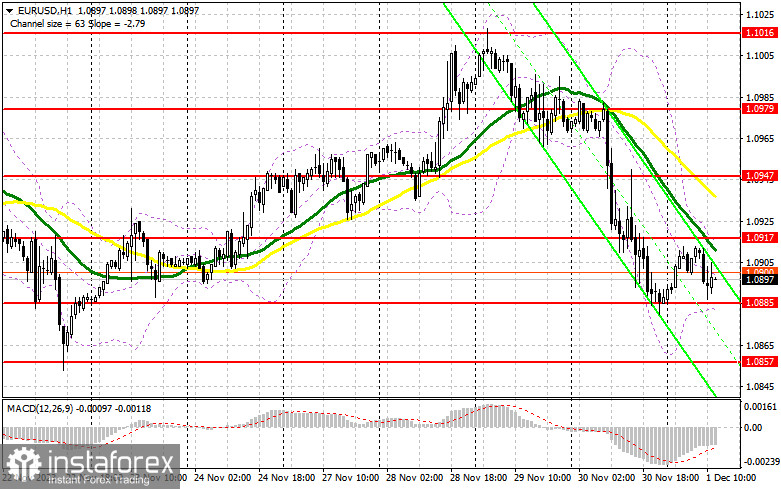
Trading is conducted below the 30- and 50-day moving averages, indicating a seller's advantage.
Note: The author considers the period and prices of moving averages on the hourly chart H1 and differs from the general definition of classical daily moving averages on the daily chart D1.
Bollinger Bands:
In the event of a decrease, the lower boundary of the indicator, around 1.0885, will act as support.
Description of Indicators:
• Moving Average (MA) is a trend indicator, smoothing volatility and noise. Period 50. Marked on the chart in yellow.
• Moving Average (MA) is a trend indicator, smoothing volatility and noise. Period 30. Marked on the chart in green.
• Moving Average Convergence/Divergence (MACD) is a trend-following momentum indicator that shows the relationship between two moving averages of an asset's price. Fast EMA period 12. Slow EMA period 26. SMA period 9.
• Bollinger Bands is an indicator that defines the current price volatility and the relative price position within the channel. Period 20.
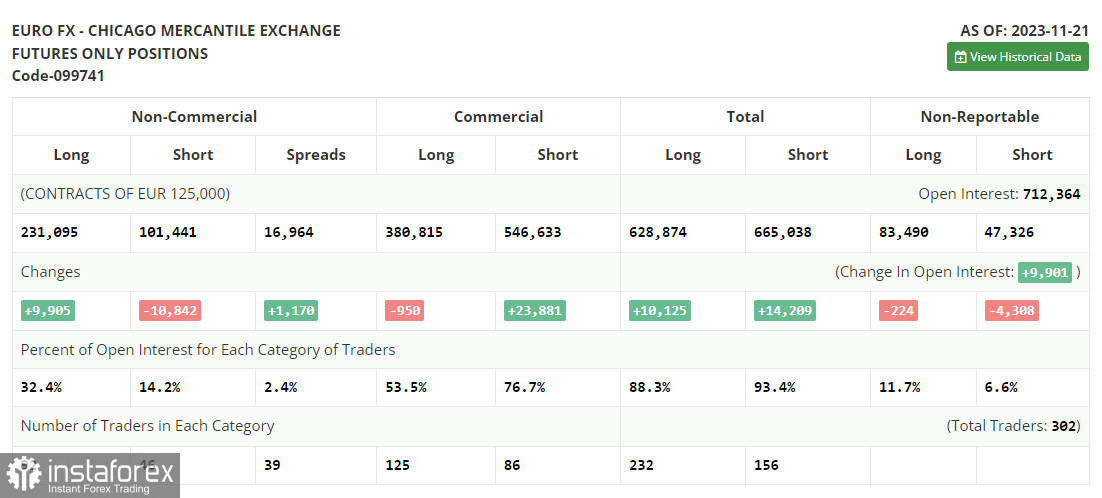
• Non-Commercial Traders - speculators, such as individual traders, hedge funds, and large institutions, use the futures market for speculative purposes and meet certain requirements.
• Long Non-Commercial Positions represent the total long open positions of non-commercial traders.
• Short Non-Commercial Positions represent the total short open positions of non-commercial traders.
• The total non-commercial net position is the difference between short and long positions of non-commercial traders.
*Phân tích thị trường được đăng tải ở đây có nghĩa là để gia tăng nhận thức của bạn, nhưng không đưa ra các chỉ dẫn để thực hiện một giao dịch.
InstaSpot analytical reviews will make you fully aware of market trends! Being an InstaSpot client, you are provided with a large number of free services for efficient trading.


