


Huyền thoại trong nhóm InstaSpot!
Huyền thoại! Bạn nghĩ rằng đó là lời nói khoa trương? Nhưng chúng ta nên gọi một người đàn ông như thế nào, người đã trở thành người châu Á đầu tiên giành chức vô địch cờ vua thế giới lứa tuổi thiếu niên năm 18 tuổi và người trở thành Đại kiện tướng Ấn Độ đầu tiên năm 19 tuổi? Đó là khởi đầu cho con đường khó khăn đến danh hiệu Vô địch Thế giới của Viswanathan Anand, người đàn ông đã trở thành một phần của lịch sử cờ vua mãi mãi. Giờ đây, một huyền thoại nữa trong nhóm InstaSpot!


Borussia là một trong những câu lạc bộ bóng đá danh giá nhất nước Đức, đã nhiều lần chứng minh cho người hâm mộ thấy: tinh thần thi đấu và sự lãnh đạo chắc chắn sẽ dẫn đến thành công. Giao dịch theo cách mà các chuyên gia thể thao chơi trò chơi: tự tin và chủ động. Giữ một "đường chuyền" từ Borussia FC và dẫn đầu với InstaSpot!
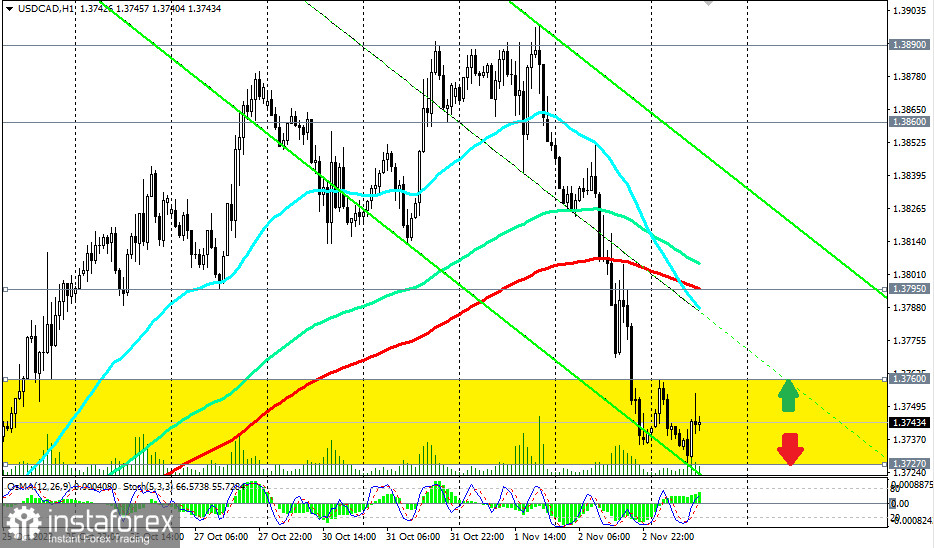
As of this writing, USD/CAD was trading near the level of 1.3743, within the midrange of today's narrow range between the levels of 1.3760 and 1.3727. In general, USD/CAD remains in the zone of medium-term support—above the level of 1.3485 (200 EMA on the daily chart), long-term support—above the level of 1.3160 (200 EMA on the weekly chart), and global support—above the level of 1.2700 (200 EMA on the monthly chart) in the bull market, also receiving support from fundamental factors.
Therefore, our main scenario is the resumption of growth. The first signal for new long positions may be the breakout of the upper boundary of the aforementioned range at 1.3760, and the breakout of the important short-term resistance level at 1.3795 (200 EMA on the 1-hour chart) would confirm it. Growth targets are located at local resistance levels of 1.3860, 1.3890, 1.3900, and 1.3970.
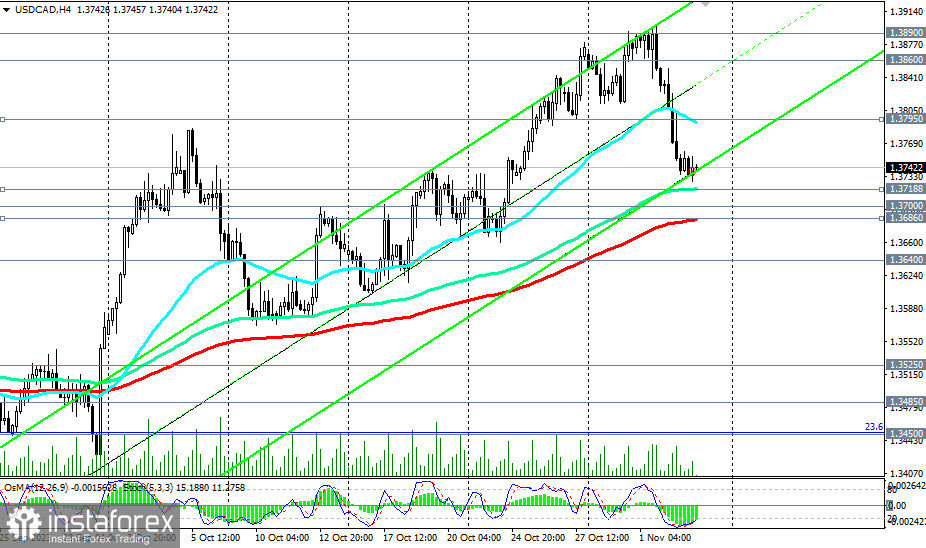
In an alternative scenario, USD/CAD will resume its decline. The first signal for selling would be the breakdown of support levels at 1.3727, 1.3719 (144 EMA on the 4-hour chart), and the confirming signal would be the breakdown of the important short-term support level at 1.3686 (200 EMA on the 4-hour chart). Downside targets include the support levels 1.3640 (50 EMA on the daily chart) and 1.3600.
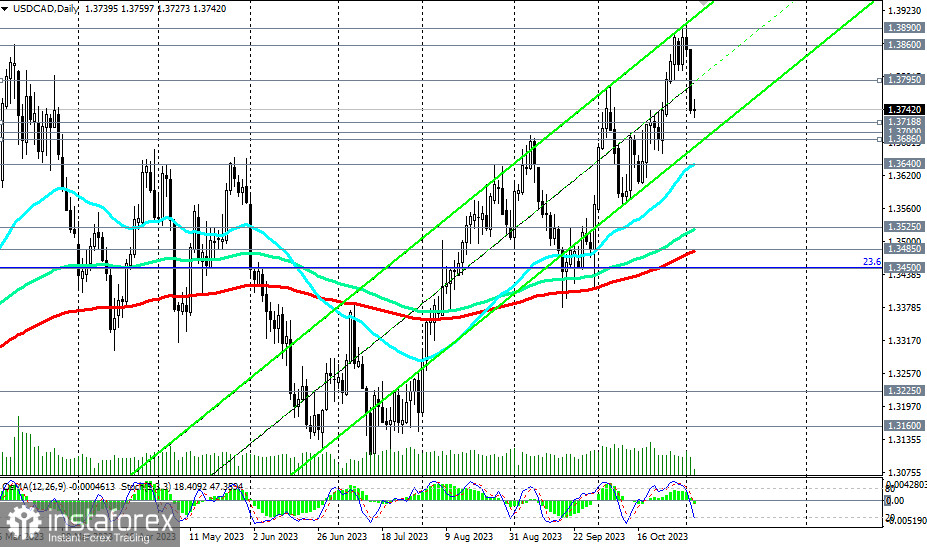
In the further development of this scenario, the breakdown of key support levels at 1.3485 and 1.3450 (23.6% Fibonacci level of the correction in the upward wave from the level of 0.9700 to 1.4600, reached in June 2016) would return USD/CAD to the medium-term bear market zone, and the break of support levels at 1.3200 and 1.3160 (200 EMA on the weekly chart) would bring it back into the long-term bear market zone, making short positions preferable again.
*Phân tích thị trường được đăng tải ở đây có nghĩa là để gia tăng nhận thức của bạn, nhưng không đưa ra các chỉ dẫn để thực hiện một giao dịch.
InstaSpot analytical reviews will make you fully aware of market trends! Being an InstaSpot client, you are provided with a large number of free services for efficient trading.


