


Huyền thoại trong nhóm InstaSpot!
Huyền thoại! Bạn nghĩ rằng đó là lời nói khoa trương? Nhưng chúng ta nên gọi một người đàn ông như thế nào, người đã trở thành người châu Á đầu tiên giành chức vô địch cờ vua thế giới lứa tuổi thiếu niên năm 18 tuổi và người trở thành Đại kiện tướng Ấn Độ đầu tiên năm 19 tuổi? Đó là khởi đầu cho con đường khó khăn đến danh hiệu Vô địch Thế giới của Viswanathan Anand, người đàn ông đã trở thành một phần của lịch sử cờ vua mãi mãi. Giờ đây, một huyền thoại nữa trong nhóm InstaSpot!


Borussia là một trong những câu lạc bộ bóng đá danh giá nhất nước Đức, đã nhiều lần chứng minh cho người hâm mộ thấy: tinh thần thi đấu và sự lãnh đạo chắc chắn sẽ dẫn đến thành công. Giao dịch theo cách mà các chuyên gia thể thao chơi trò chơi: tự tin và chủ động. Giữ một "đường chuyền" từ Borussia FC và dẫn đầu với InstaSpot!
Orders for durable goods in the United States unexpectedly rose by 0.2% in August, despite expectations of a 1.4% decline. This disparity in expectations led to the subsequent strengthening of the U.S. dollar.
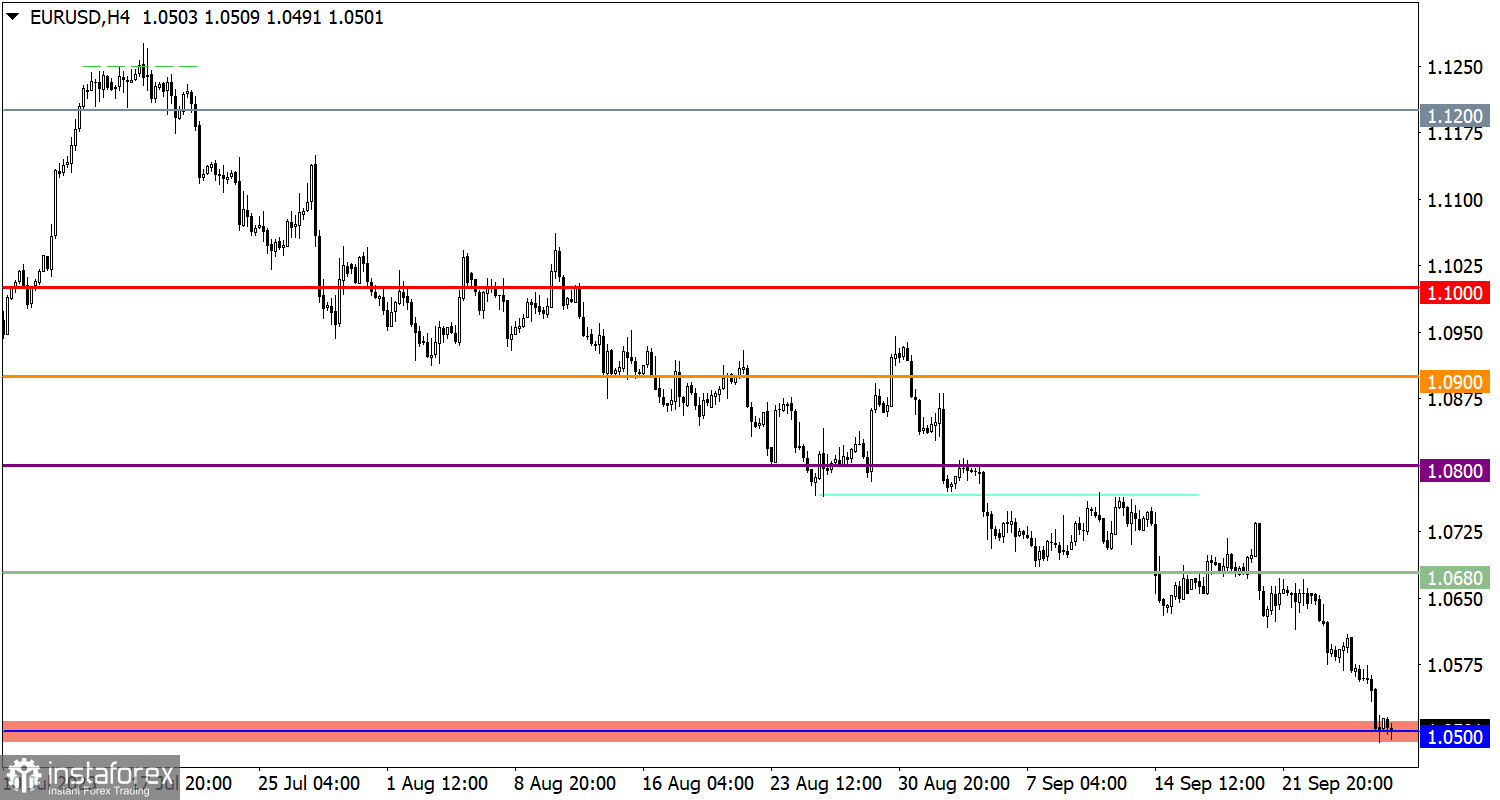
The EUR/USD currency pair reached the 1.0500 support level during the inertial movement. As a result, a reduction in short positions was observed, but a speculative bearish sentiment still prevails among market participants.
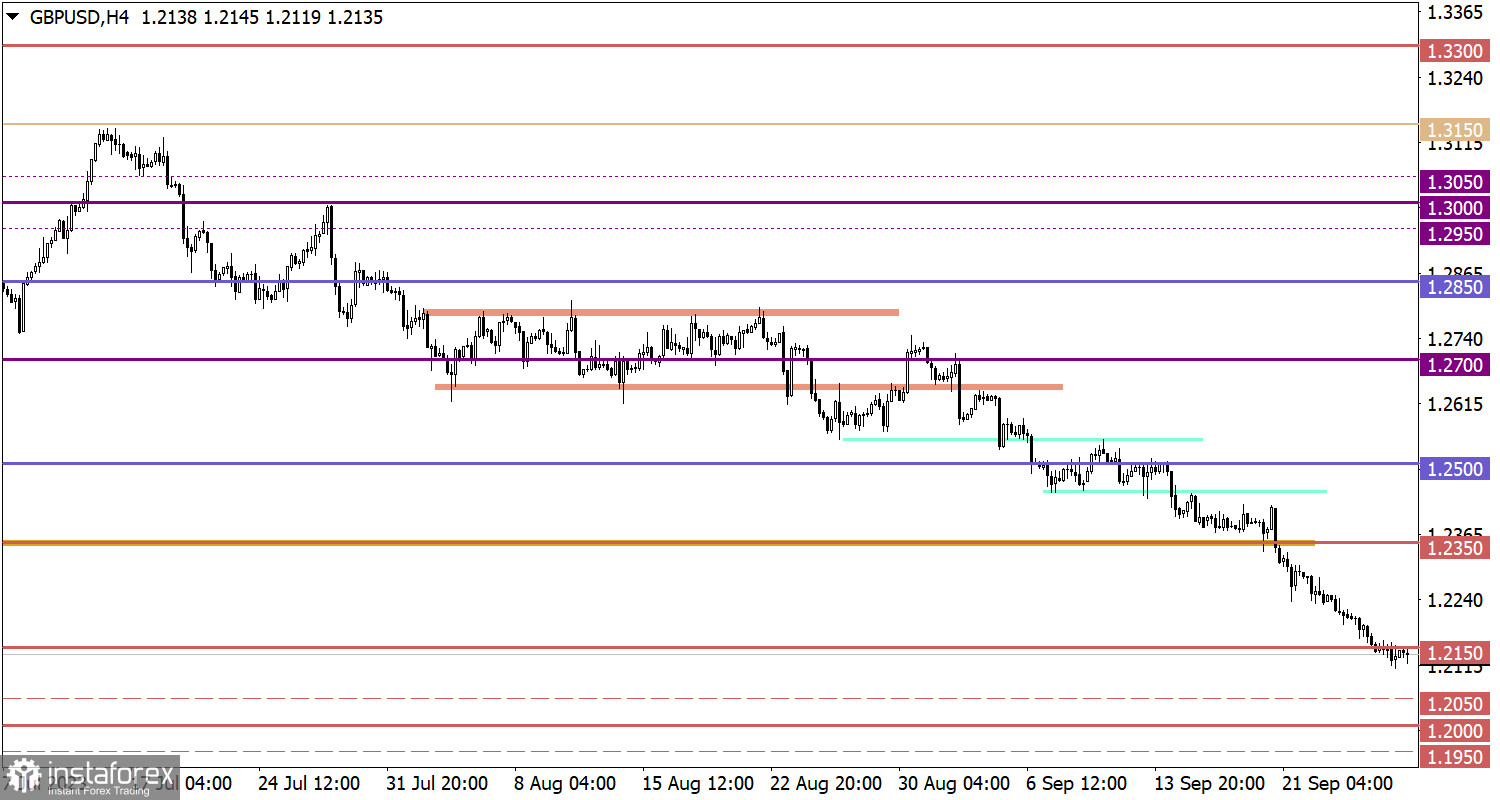
The GBP/USD pair stabilized below the 1.2150 level, indicating a prevailing bearish sentiment among market participants.

Today, the final GDP data for the United States is expected to be published, but it is expected to merely confirm the preliminary estimates already factored in by the market.
Attention may be drawn to the U.S. jobless claims, where an increase is anticipated. Detailed statistical data shows that the volume of continuing jobless claims may rise from 1.662 million to 1.675 million, while initial jobless claims may increase from 201,000 to 215,000.
Time Targeting
EU GDP – 12:30 UTC
U.S. Jobless Claims – 12:30 UTC
Stabilization of the price below the 1.0500 support level may further weaken the euro's exchange rate, contrary to technical signals of oversold conditions. In this case, the inertial trend driven by speculators may persist in the market for some time.
As for the bullish scenario, traders view it as a technical rebound. The area around the 1.0500 support level may serve as a support.
In case the inertial trend persists in the market, and traders continue to ignore the technical oversold signal of the British pound, a subsequent decline in the exchange rate towards the psychological level of 1.2000 is possible.
The candlestick chart type is white and black graphic rectangles with lines above and below. With a detailed analysis of each individual candle, you can see its characteristics relative to a particular time frame: opening price, closing price, intraday high and low.
Horizontal levels are price coordinates, relative to which a price may stop or reverse its trajectory. In the market, these levels are called support and resistance.
Circles and rectangles are highlighted examples where the price reversed in history. This color highlighting indicates horizontal lines that may put pressure on the asset's price in the future.
The up/down arrows are landmarks of the possible price direction in the future.
*Phân tích thị trường được đăng tải ở đây có nghĩa là để gia tăng nhận thức của bạn, nhưng không đưa ra các chỉ dẫn để thực hiện một giao dịch.
InstaSpot analytical reviews will make you fully aware of market trends! Being an InstaSpot client, you are provided with a large number of free services for efficient trading.


