


Đội ngũ của chúng tôi có hơn 7,000,000 thương nhân!
Hàng ngày chúng tôi làm việc cùng nhau để cải thiện việc giao dịch. Chúng tôi nhận được kết quả cao và luôn tiến lên phía trước.
Sự công nhận của hàng triệu thương nhân trên toàn thế giới là sự đánh giá tốt nhất cho công việc của chúng tôi! Bạn đã đưa ra quyết định của mình và chúng tôi sẽ làm mọi thứ cần thiết để đáp ứng mong đợi của bạn!
Chúng ta cùng với nhau sẽ là một nhóm tuyệt vời!
InstaSpot. Tự hào làm việc cho bạn!


Diễn viên, nhà vô địch mùa giải UFC 6 và là người hùng thật sự!
Người tự mình làm nên tất cả. Người đàn ông đáng kể học hỏi.
Bí mật đằng sau thành công của Taktarov là sự cố gắng liên tục hướng tới mục tiêu.
Hãy khai phá tất cả các mặt tài năng của bạn!
Khám phá, thử, thất bại - nhưng không bao giờ dừng lại!
InstaSpot. Câu chuyện thành công của bạn bắt đầu từ đây!
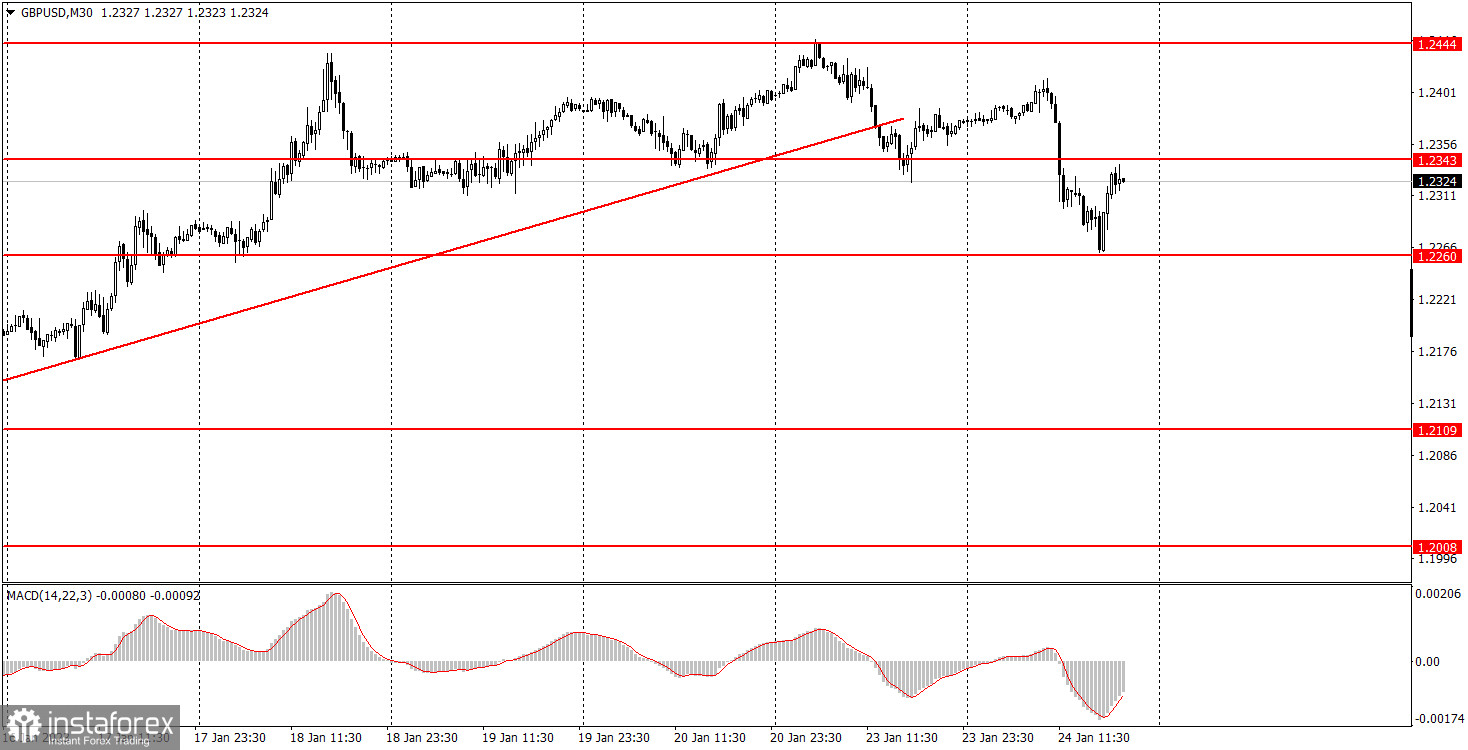
On Tuesday, GBP/USD continued the downward movement that started the day before. Recall that on Monday, the price was below the ascending trend line, which is a signal for a change of trend to a downward one. We had doubts that the pound could surpass 1.2343, but apparently it was easy and the British currency even managed to do it quickly on Tuesday morning. We don't know what triggered the pound's fall during the day. Most likely it was a technical fall, since the macro data from the UK were unusually contradictory. Formally it might have provoked the fall of the quotes, but I don't think so. Anyway, the pair might be just at the beginning of a new prolonged decline, which might last for several weeks. I believe that such a turn of events will be quite logical, taking into account the recent fundamental background.
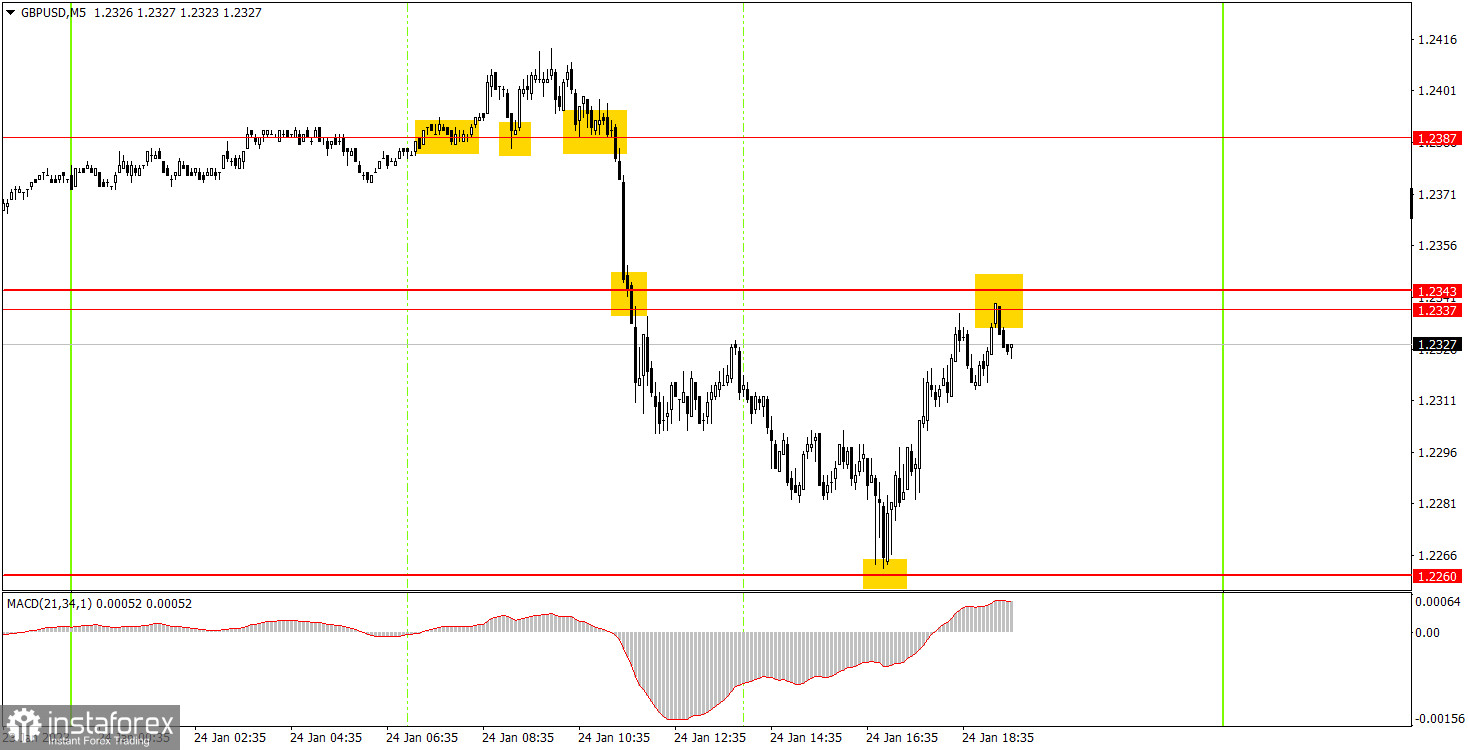
There were a lot of trading signals on Tuesday. Some of them were very good and not only was it possible to make profit, but we could also close the loss on the EUR/USD pair. First of all, the pair rebounded twice from 1.2387. Both signals were false and duplicated each other. The pair failed to go up the 20 points necessary for setting a Stop Loss, but it's alright since there was only one open position, and the next sell signal near 1.2387 was available for execution. After the price had settled below 1.2387, it fell to 1.2260, and almost perfectly rebounded from it. Thus, novice traders could earn about 100 pips on the short position. The buy signal at 1.2260 should have worked too, and the price reached 1.2337, where long positions should have been closed. Thus, the profit for them was another 50 pips. Thus, the total profit was about 150 pips, which allowed newcomers to make profit.
On the 30-minute chart, GBP/USD still tries to follow the technical signals and continues falling after crossing the trend line. Today it stopped at 1.2260. Although the fundamental and macroeconomic background is rather poor this week, the pound shows that it is not going to stand still. On the 5-minute chart, it is recommended to trade at the levels 1.2109, 1.2171-1.2179, 1.2245-1.2260, 1.2337-1.2343, 1.2387, 1.2444-1.2471, 1.2577-1.2597. As soon as the price passes 20 pips in the right direction, you should set a Stop Loss to breakeven. There are no interesting events planned for Wednesday in the UK and the US, so there will be nothing to react to during the day. I would say that it is possible for the euro to be flat, but in the pound's case, the downtrend is likely to continue. Though, volatility might go down.
1) The strength of the signal is determined by the time it took the signal to form (a rebound or a breakout of the level). The quicker it is formed, the stronger the signal is.
2) If two or more positions were opened near a certain level based on a false signal (which did not trigger a Take Profit or test the nearest target level), then all subsequent signals at this level should be ignored.
3) When trading flat, a pair can form multiple false signals or not form them at all. In any case, it is better to stop trading at the first sign of a flat movement.
4) Trades should be opened in the period between the start of the European session and the middle of the US trading hours when all positions must be closed manually.
5) You can trade using signals from the MACD indicator on the 30-minute time frame only amid strong volatility and a clear trend that should be confirmed by a trendline or a trend channel.
6) If two levels are located too close to each other (from 5 to 15 pips), they should be considered support and resistance levels.
Support and Resistance levels are the levels that serve as targets when buying or selling the pair. You can place Take Profit near these levels.
Red lines are channels or trend lines that display the current trend and show in which direction it is better to trade now.
The MACD indicator (14, 22, and 3) consists of a histogram and a signal line. When they cross, this is a signal to enter the market. It is recommended to use this indicator in combination with trend patterns (channels and trendlines).
Important announcements and economic reports that can be found on the economic calendar can seriously influence the trajectory of a currency pair. Therefore, at the time of their release, we recommend trading as carefully as possible or exiting the market in order to avoid sharp price fluctuations.
Beginners on Forex should remember that not every single trade has to be profitable. The development of a clear strategy and money management is the key to success in trading over a long period of time.
*Phân tích thị trường được đăng tải ở đây có nghĩa là để gia tăng nhận thức của bạn, nhưng không đưa ra các chỉ dẫn để thực hiện một giao dịch.
InstaSpot analytical reviews will make you fully aware of market trends! Being an InstaSpot client, you are provided with a large number of free services for efficient trading.


