


Đội ngũ của chúng tôi có hơn 7,000,000 thương nhân!
Hàng ngày chúng tôi làm việc cùng nhau để cải thiện việc giao dịch. Chúng tôi nhận được kết quả cao và luôn tiến lên phía trước.
Sự công nhận của hàng triệu thương nhân trên toàn thế giới là sự đánh giá tốt nhất cho công việc của chúng tôi! Bạn đã đưa ra quyết định của mình và chúng tôi sẽ làm mọi thứ cần thiết để đáp ứng mong đợi của bạn!
Chúng ta cùng với nhau sẽ là một nhóm tuyệt vời!
InstaSpot. Tự hào làm việc cho bạn!


Diễn viên, nhà vô địch mùa giải UFC 6 và là người hùng thật sự!
Người tự mình làm nên tất cả. Người đàn ông đáng kể học hỏi.
Bí mật đằng sau thành công của Taktarov là sự cố gắng liên tục hướng tới mục tiêu.
Hãy khai phá tất cả các mặt tài năng của bạn!
Khám phá, thử, thất bại - nhưng không bao giờ dừng lại!
InstaSpot. Câu chuyện thành công của bạn bắt đầu từ đây!
Weekly jobless claims data came out slightly better than expected, but the overall figure still reflected an increase in their numbers.
Statistics details:
The volume of continuing claims for benefits rose from 1.630 million to 1.647 million.
The volume of initial claims for benefits fell from 205,000 to 190,000.
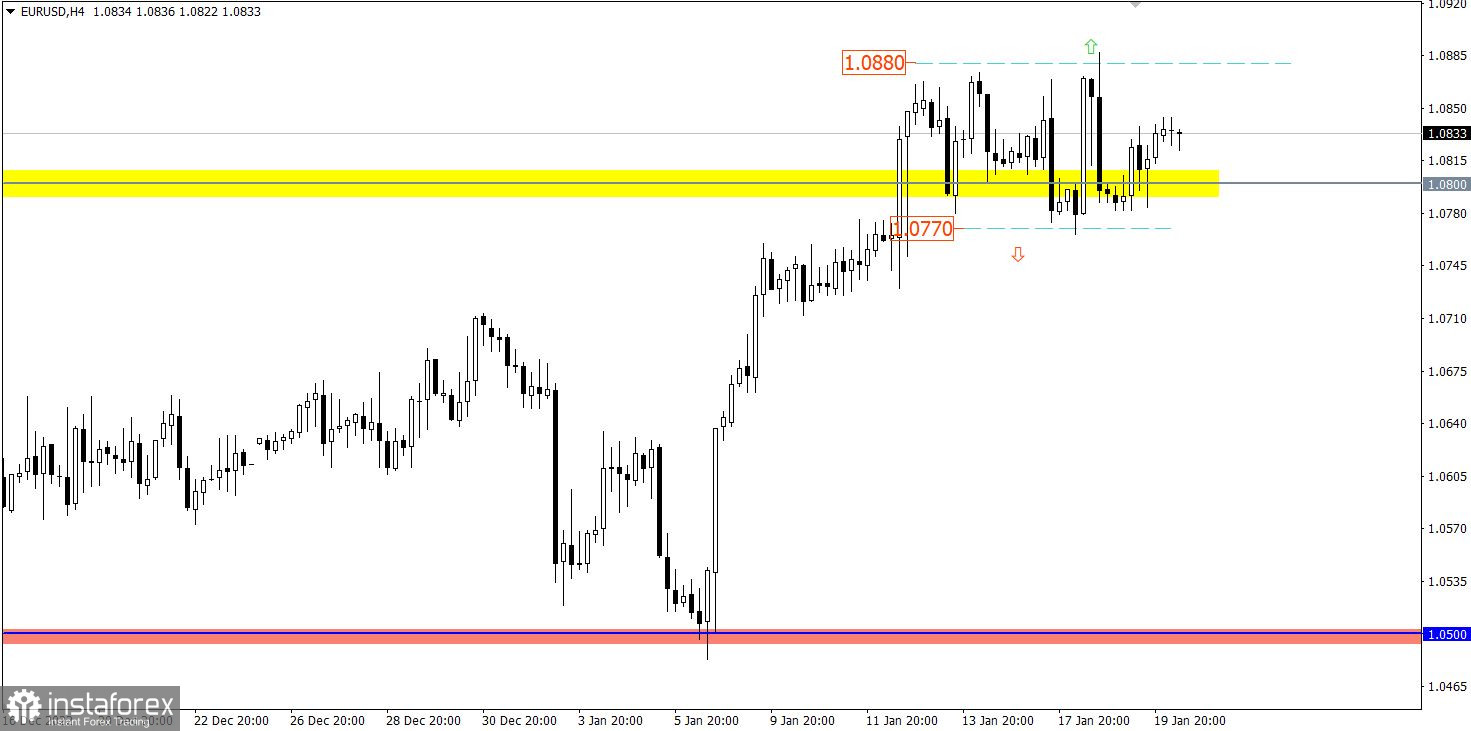
EURUSD has been moving sideways during the entire trading week at the peak of the upward cycle. This price movement indicates the process of accumulation of trading forces, otherwise the market would have a corrective movement, which was brewing at the beginning of the week.
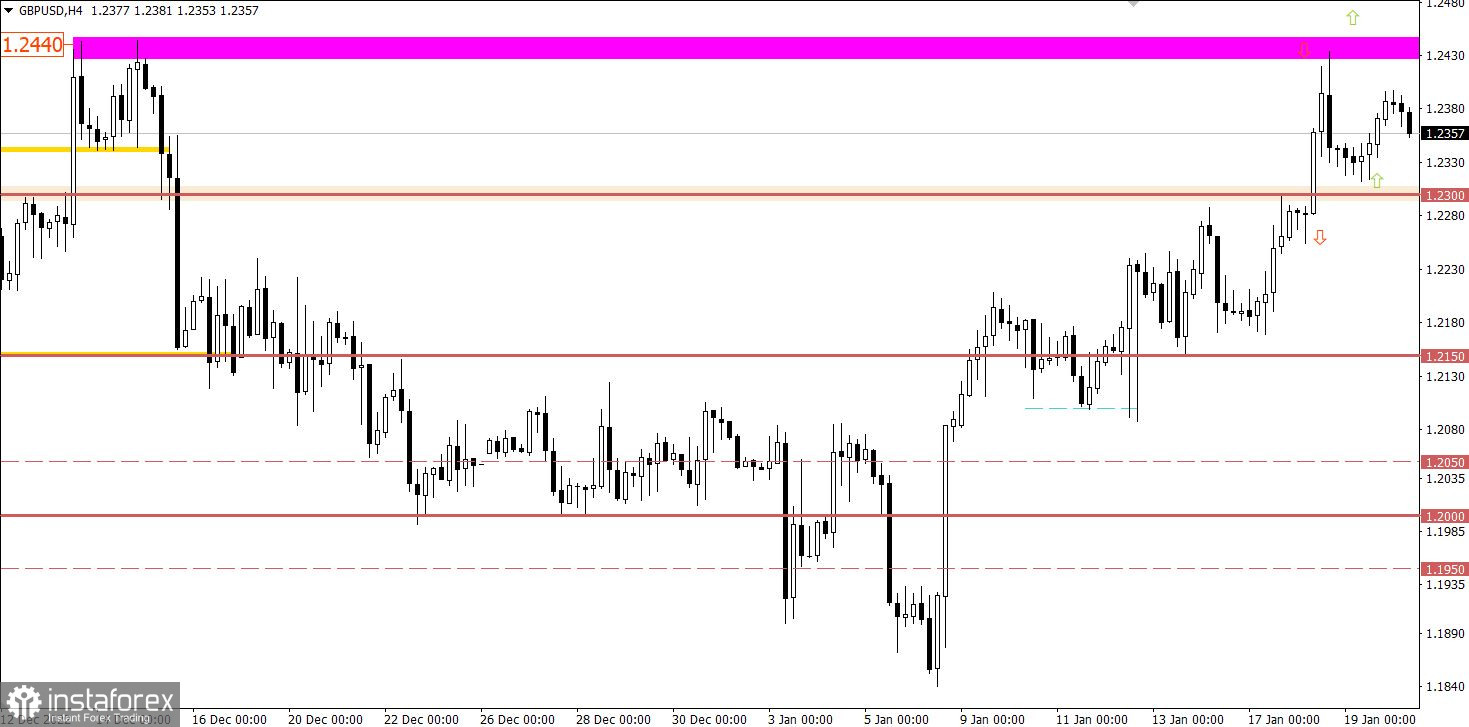
GBPUSD temporarily returned to the level of 1.2300 during the technical pullback from the local high of December, where a rebound occurred. This price fluctuation is indicative of the continued upward trend among traders in the market.

Since the opening of the European session, data on UK retail sales have been published. The rate of decline was estimated to slow down from -5.7% to -4.1%, but actual data showed that the rate of decline accelerated to -5.8%, which negatively affected the value of the British pound.
Based on the structure and tact of price movement, we can assume that the current flat is in the finishing phase. Thus, a long stop may well serve as a lever for new speculative price jumps.
The optimal strategy is considered the method of outgoing momentum, which in the theory of technical analysis can indicate the subsequent path of the price.
We concretize the above:
The downward move will be relevant after holding the price below 1.0770 in a four-hour period. This step can lead to the formation of a full-size correction.
The upward movement of the currency pair is considered in case of a stable holding of the price above the value of 1.0880 in a four-hour period. This move will indicate a continuation of the upward trend.
In order for a technical signal about the prolongation of the upward cycle to appear, the quote needs to stay above the value of 1.2450 for at least a four-hour period.
Otherwise, it allows an amplitude move within 1.2300/1.2440.
The candlestick chart type is white and black graphic rectangles with lines above and below. With a detailed analysis of each individual candle, you can see its characteristics relative to a particular time frame: opening price, closing price, intraday high and low.
Horizontal levels are price coordinates, relative to which a price may stop or reverse its trajectory. In the market, these levels are called support and resistance.
Circles and rectangles are highlighted examples where the price reversed in history. This color highlighting indicates horizontal lines that may put pressure on the asset's price in the future.
The up/down arrows are landmarks of the possible price direction in the future.
*Phân tích thị trường được đăng tải ở đây có nghĩa là để gia tăng nhận thức của bạn, nhưng không đưa ra các chỉ dẫn để thực hiện một giao dịch.
InstaSpot analytical reviews will make you fully aware of market trends! Being an InstaSpot client, you are provided with a large number of free services for efficient trading.


