


Huyền thoại trong nhóm InstaSpot!
Huyền thoại! Bạn nghĩ rằng đó là lời nói khoa trương? Nhưng chúng ta nên gọi một người đàn ông như thế nào, người đã trở thành người châu Á đầu tiên giành chức vô địch cờ vua thế giới lứa tuổi thiếu niên năm 18 tuổi và người trở thành Đại kiện tướng Ấn Độ đầu tiên năm 19 tuổi? Đó là khởi đầu cho con đường khó khăn đến danh hiệu Vô địch Thế giới của Viswanathan Anand, người đàn ông đã trở thành một phần của lịch sử cờ vua mãi mãi. Giờ đây, một huyền thoại nữa trong nhóm InstaSpot!


Borussia là một trong những câu lạc bộ bóng đá danh giá nhất nước Đức, đã nhiều lần chứng minh cho người hâm mộ thấy: tinh thần thi đấu và sự lãnh đạo chắc chắn sẽ dẫn đến thành công. Giao dịch theo cách mà các chuyên gia thể thao chơi trò chơi: tự tin và chủ động. Giữ một "đường chuyền" từ Borussia FC và dẫn đầu với InstaSpot!
The market's attention was on data on inflation in the United States, which shows a steady slowdown for sixth months. Consumer prices amounted to 6.5% in December, which is the minimum for more than a year after October 2021.
Inflation in November was 7.1%, and in September at 8.2%. Positive dynamics indicates an early easing of pressure from the Fed.
Philadelphia Fed President Patrick Harker did not keep the markets waiting and almost immediately left his comments on the decline in inflation.
Main theses:
- Time to switch to a 0.25% rate hike step;
- The time for large-scale rate hikes is over;
- The peak of inflation is probably behind;
- A recession is unlikely, but U.S. GDP growth should slow down and unemployment should rise.
Financial markets welcomed the inflation data, and the U.S. dollar was steadily losing ground against its main competitors.
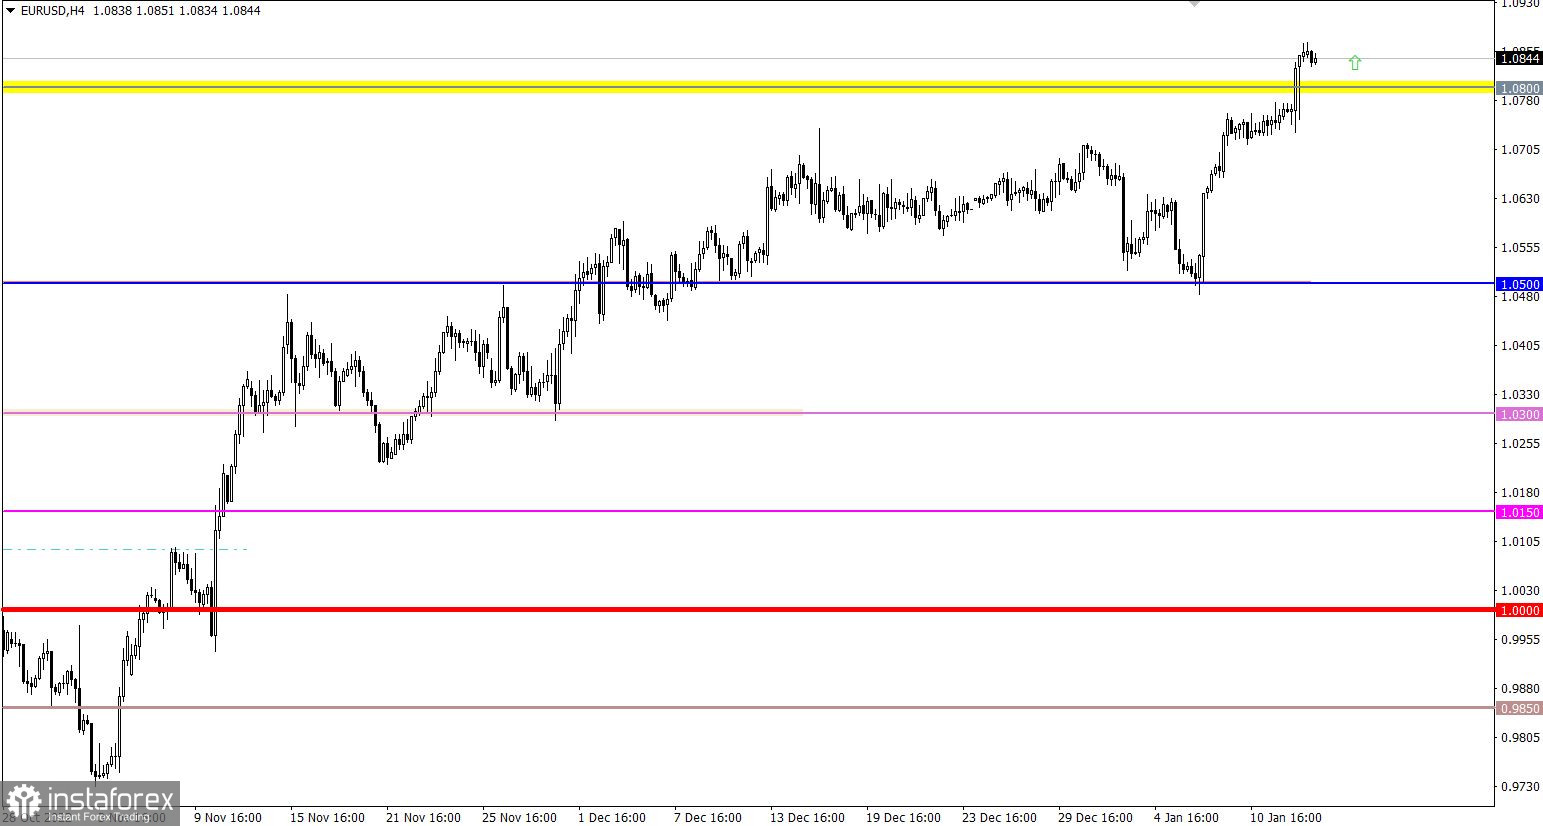
The EURUSD currency pair updated the local high of the upward cycle during a speculative jump against the background of inflation data in the United States. As a result, the 1.0800 resistance level was passed, which became another technical signal about the prolongation of the medium-term trend from October last year.
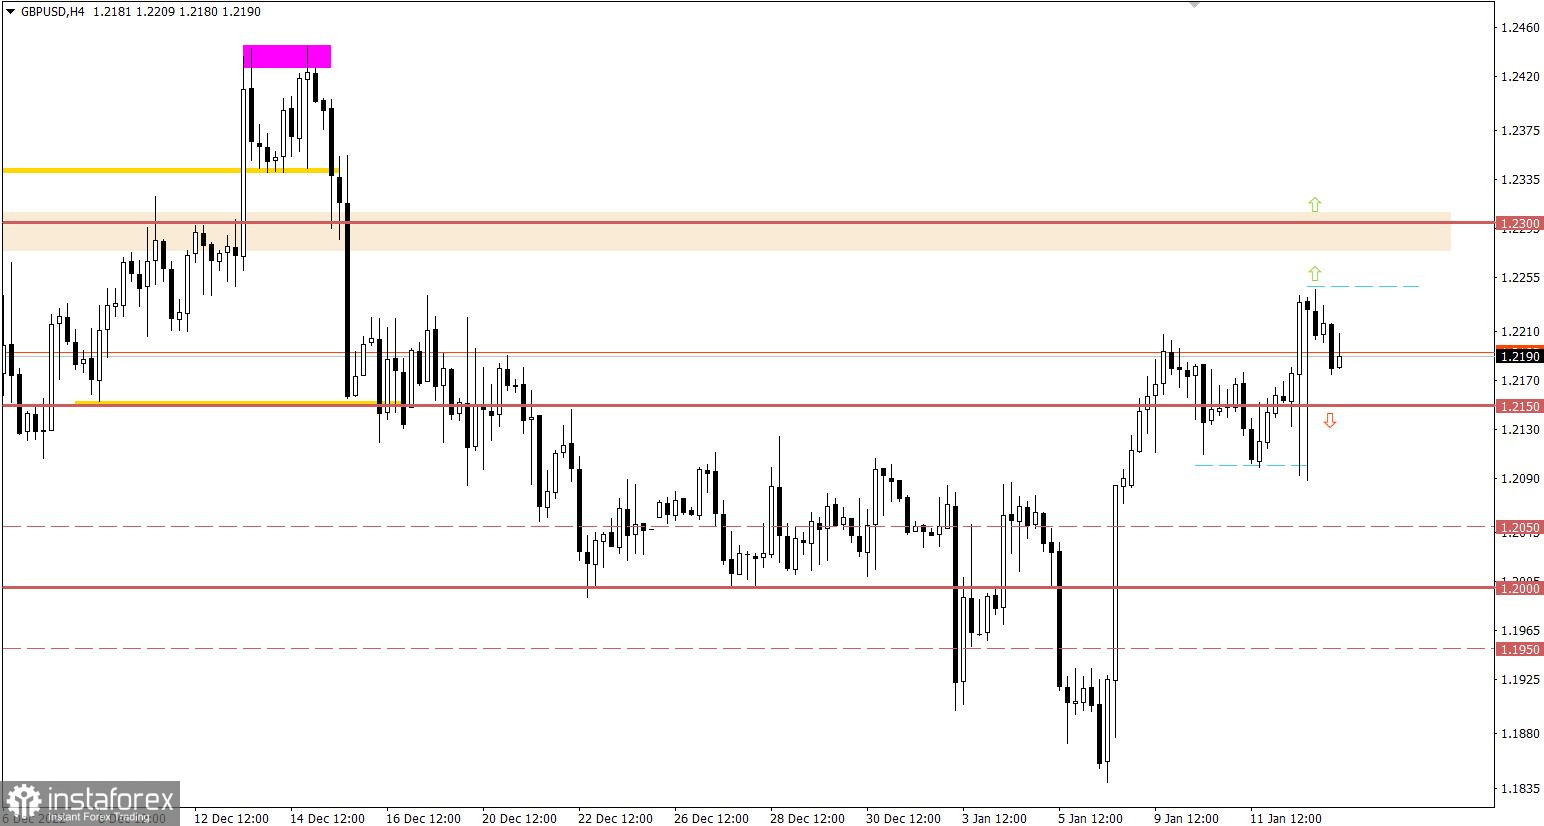
The GBPUSD currency pair updated the local high of the current week during the upward rally. As a result, the quote jumped above 1.2200 for a while, but the joy of buyers did not last long. Almost immediately, there was a reverse movement, which indicates a technical signal on the market that the pound is overbought.
Since the opening of the European market, UK statistical data have been published. The volume of industrial production accelerated the decline from -2.4% to -5.1%, which is a strong negative factor.
In Europe, the publication of data on industrial production is expected, where a sharp slowdown in the growth rate from 3.4% to 0.8% is observed year-on-year. It's not the best factor for the economy, but it's worth looking at the actual data. Meanwhile, U.S. inflation is still on the background, which means leverage to sell off dollar positions.
Stable price retention above the 1.0800 level in the future may lead to a subsequent increase in the volume of long positions. This opens the way for buyers in the direction of the 1.1000 psychological level.
It is worth noting that there is already a technical signal about the euro being overbought, which allows for a pullback. However, speculators may ignore the signals from technical analysis and continue to form an inertial move.
A temporary stop in the upward cycle can serve as a regrouping of trading forces, where a technical signal of an overbought pound sterling can be rethought by traders. In this case, the subsequent growth may not make you wait, but for its confirmation it is necessary to hold the price above the value of 1.2250.
Keeping the price at the stage of regrouping of trading forces may resume the amplitude of 1.2100/1.2200 in case of holding the price below the value of 1.2150.
The candlestick chart type is white and black graphic rectangles with lines above and below. With a detailed analysis of each individual candle, you can see its characteristics relative to a particular time frame: opening price, closing price, intraday high and low.
Horizontal levels are price coordinates, relative to which a price may stop or reverse its trajectory. In the market, these levels are called support and resistance.
Circles and rectangles are highlighted examples where the price reversed in history. This color highlighting indicates horizontal lines that may put pressure on the asset's price in the future.
The up/down arrows are landmarks of the possible price direction in the future.
*Phân tích thị trường được đăng tải ở đây có nghĩa là để gia tăng nhận thức của bạn, nhưng không đưa ra các chỉ dẫn để thực hiện một giao dịch.
InstaSpot analytical reviews will make you fully aware of market trends! Being an InstaSpot client, you are provided with a large number of free services for efficient trading.


