


Đội ngũ của chúng tôi có hơn 7,000,000 thương nhân!
Hàng ngày chúng tôi làm việc cùng nhau để cải thiện việc giao dịch. Chúng tôi nhận được kết quả cao và luôn tiến lên phía trước.
Sự công nhận của hàng triệu thương nhân trên toàn thế giới là sự đánh giá tốt nhất cho công việc của chúng tôi! Bạn đã đưa ra quyết định của mình và chúng tôi sẽ làm mọi thứ cần thiết để đáp ứng mong đợi của bạn!
Chúng ta cùng với nhau sẽ là một nhóm tuyệt vời!
InstaSpot. Tự hào làm việc cho bạn!


Diễn viên, nhà vô địch mùa giải UFC 6 và là người hùng thật sự!
Người tự mình làm nên tất cả. Người đàn ông đáng kể học hỏi.
Bí mật đằng sau thành công của Taktarov là sự cố gắng liên tục hướng tới mục tiêu.
Hãy khai phá tất cả các mặt tài năng của bạn!
Khám phá, thử, thất bại - nhưng không bao giờ dừng lại!
InstaSpot. Câu chuyện thành công của bạn bắt đầu từ đây!
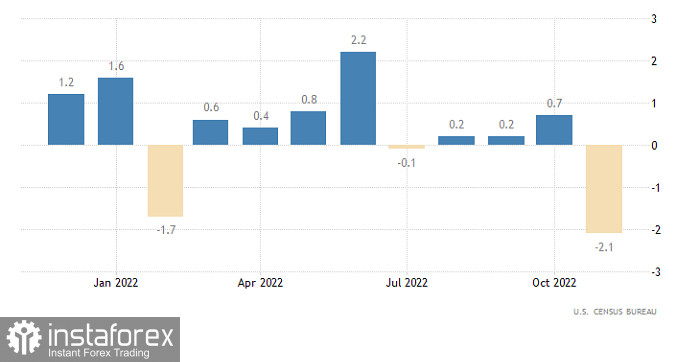
On Friday, the US published mixed data. Thus, the euro was quite stable. On the one hand, durable goods orders dropped by 2.1%, whereas economists had expected a decline of just 0.5%. Meanwhile, new home sales, which should have decreased by 5.0%, increased by 5.8%. The reports were published at a different time and each of them should have influenced the market. Thus, the US dollar was expected to decline and then recoup all the losses. However, the situation was the opposite. The market simply ignored the macroeconomic data. There is no wonder since all the previous week, the market was ignoring all the reports and the euro was trading in a narrow range. What is more, Friday was the last working day before Christmas and it seemed that investors left for the holidays long ago. Today, the US and Europe continue to celebrate the holiday. That is why the market is likely to remain stuck until the next year.
US Durable Goods Orders
The euro/dollar pair has been trading within the sideways channel of 1.0580/1.0660 for the second week in a row. This movement points to uncertainty among traders and an accumulation process. Traders should also take into account that trading activity usually falls in the last working days of the year.
On the four-hour chart, the RSI technical indicator is hovering along the mid line 50, which corresponds to a flat movement. On the daily chart, the indicator is moving in the upper area of 50/70, which points to the bullish sentiment.
On the four-hour chart, the Alligator's MAs have numerous intersections, which corresponds to the flat movement. On the daily chart, the indicator is ignoring local price changes. The MAs are headed upwards.
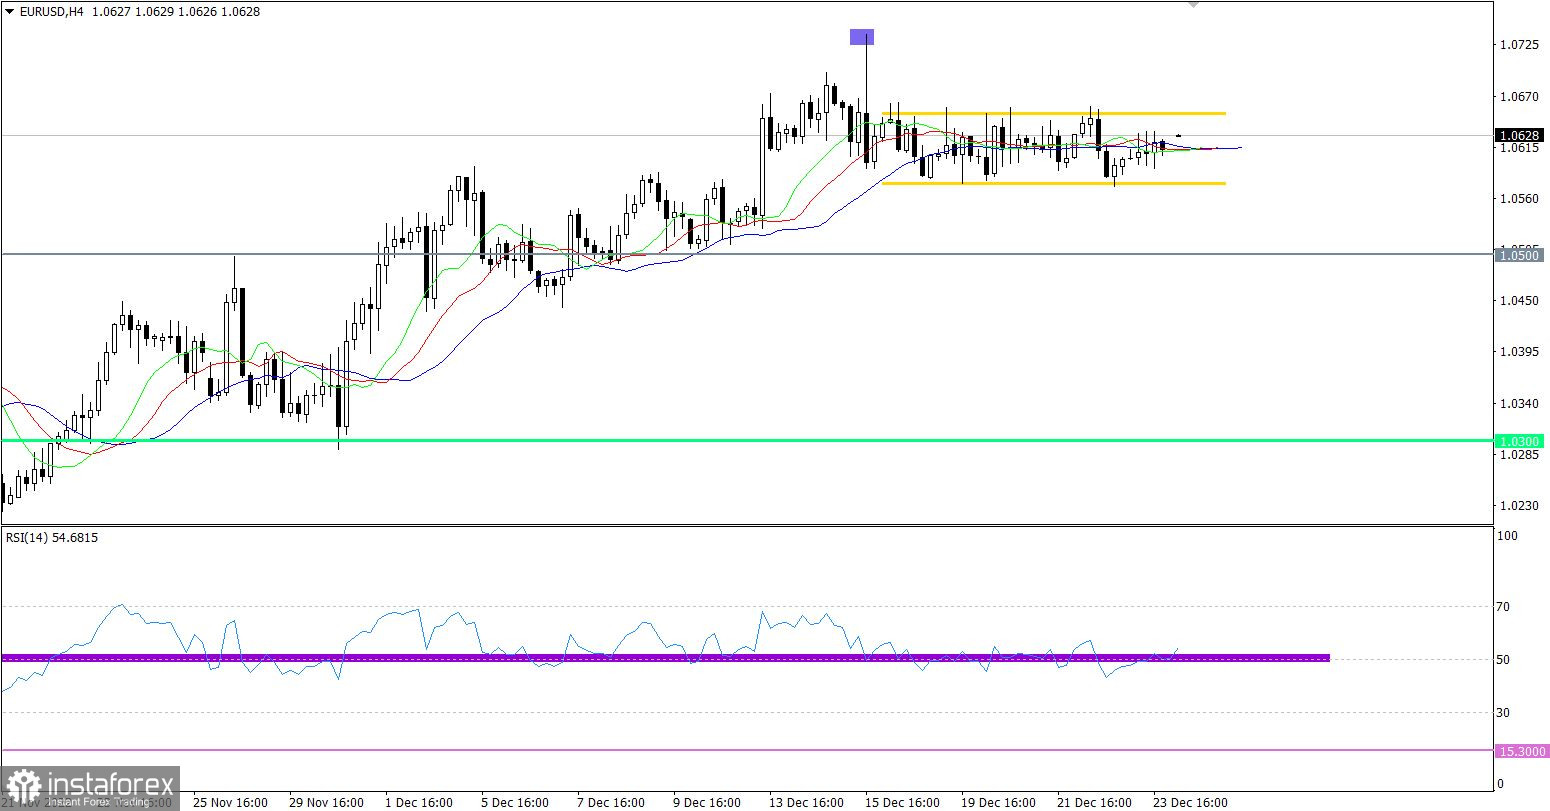
Outlook
The long-lasting sideways movement may lead to new price changes. Under the current conditions, traders should wait for the price settlement beyond either limit. In this case, they will get a technical signal of a breakout, which will point to further price movement.
In terms of the complex indicator analysis, we see that in the short-term and intraday periods, the indicator is providing a mixed signal because of stagnation. In the mid-term period, the indicators are ignoring local price changes, still providing a buy signal.
*Phân tích thị trường được đăng tải ở đây có nghĩa là để gia tăng nhận thức của bạn, nhưng không đưa ra các chỉ dẫn để thực hiện một giao dịch.
InstaSpot analytical reviews will make you fully aware of market trends! Being an InstaSpot client, you are provided with a large number of free services for efficient trading.


