


Huyền thoại trong nhóm InstaSpot!
Huyền thoại! Bạn nghĩ rằng đó là lời nói khoa trương? Nhưng chúng ta nên gọi một người đàn ông như thế nào, người đã trở thành người châu Á đầu tiên giành chức vô địch cờ vua thế giới lứa tuổi thiếu niên năm 18 tuổi và người trở thành Đại kiện tướng Ấn Độ đầu tiên năm 19 tuổi? Đó là khởi đầu cho con đường khó khăn đến danh hiệu Vô địch Thế giới của Viswanathan Anand, người đàn ông đã trở thành một phần của lịch sử cờ vua mãi mãi. Giờ đây, một huyền thoại nữa trong nhóm InstaSpot!


Borussia là một trong những câu lạc bộ bóng đá danh giá nhất nước Đức, đã nhiều lần chứng minh cho người hâm mộ thấy: tinh thần thi đấu và sự lãnh đạo chắc chắn sẽ dẫn đến thành công. Giao dịch theo cách mà các chuyên gia thể thao chơi trò chơi: tự tin và chủ động. Giữ một "đường chuyền" từ Borussia FC và dẫn đầu với InstaSpot!
The focus of the macroeconomic calendar was the striking data on inflation in the United States, which fell from 8.2% to 7.7%. This is the fourth consecutive decline in inflation, but the point is different. Forecasts assumed a fall by 0.2%, but actual data fell by as much as 0.5%.
This news was a catalyst for trading forces in the financial markets. US stock indices showed a sharp increase of 5–7%, while dollar positions fell under a total sell-off.
The reason for such a dynamic market lies in a simple, understandable logic—the Fed is currently focusing its policy on inflation. The decision on the interest rate is connected with inflation dynamics. Thus, if inflation declines faster than the forecast, the decision to slow down the rate hike may be made during the December meeting of the Fed.
As for the US ballot count, the preliminary totals are as follows:
House of Representatives: Democrats 192 - Republicans 211. Control requires 218 seats out of 435.
Senate: Democrats 48 - Republicans 49. Control requires 51 seats out of 100.
The data is not final, the ballots are still being counted.
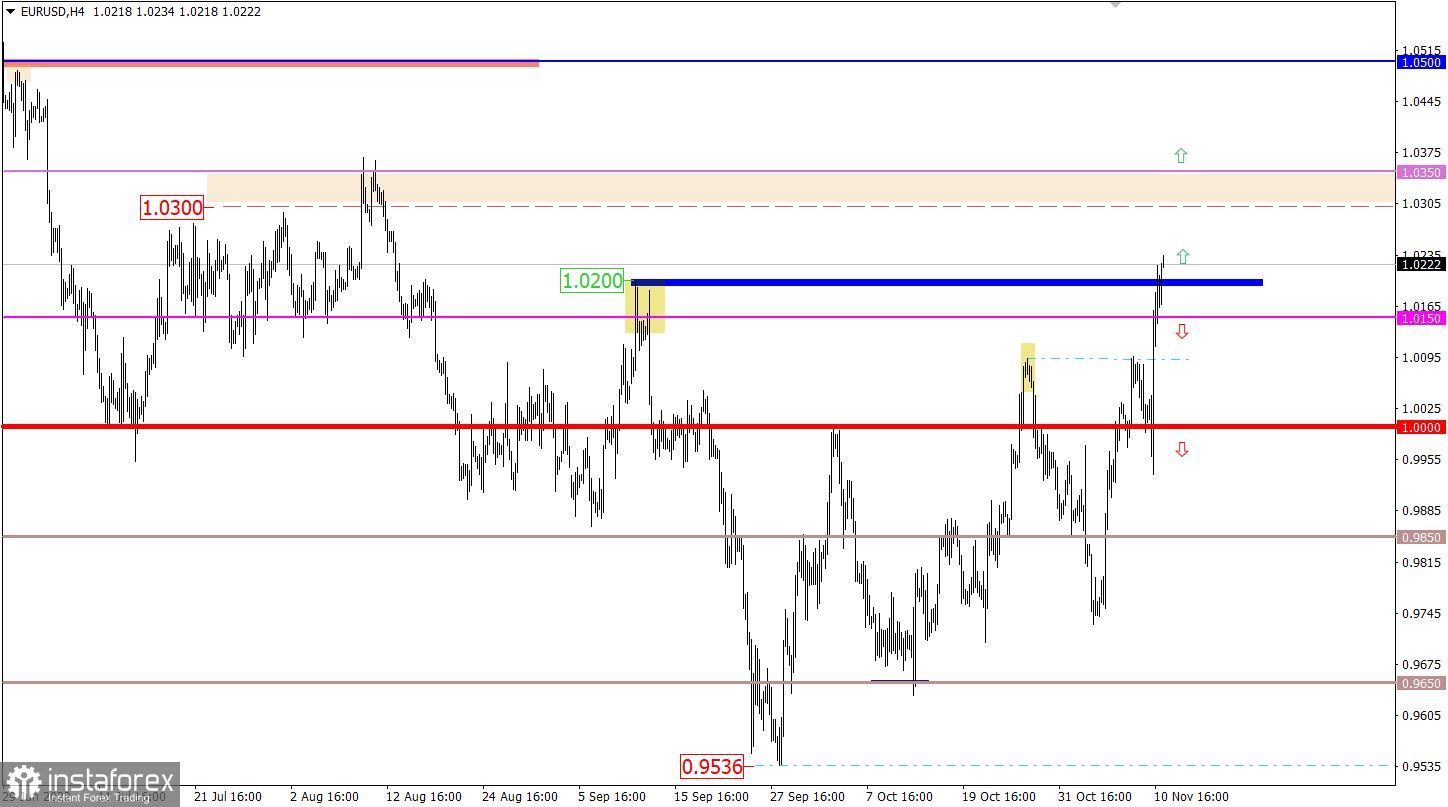
The EURUSD currency pair has strengthened in value by more than 250 points. As a result, the local high of October was updated, as well as the September high. In fact, this strongest price move indicated the possibility of a change of trading interests in the market.
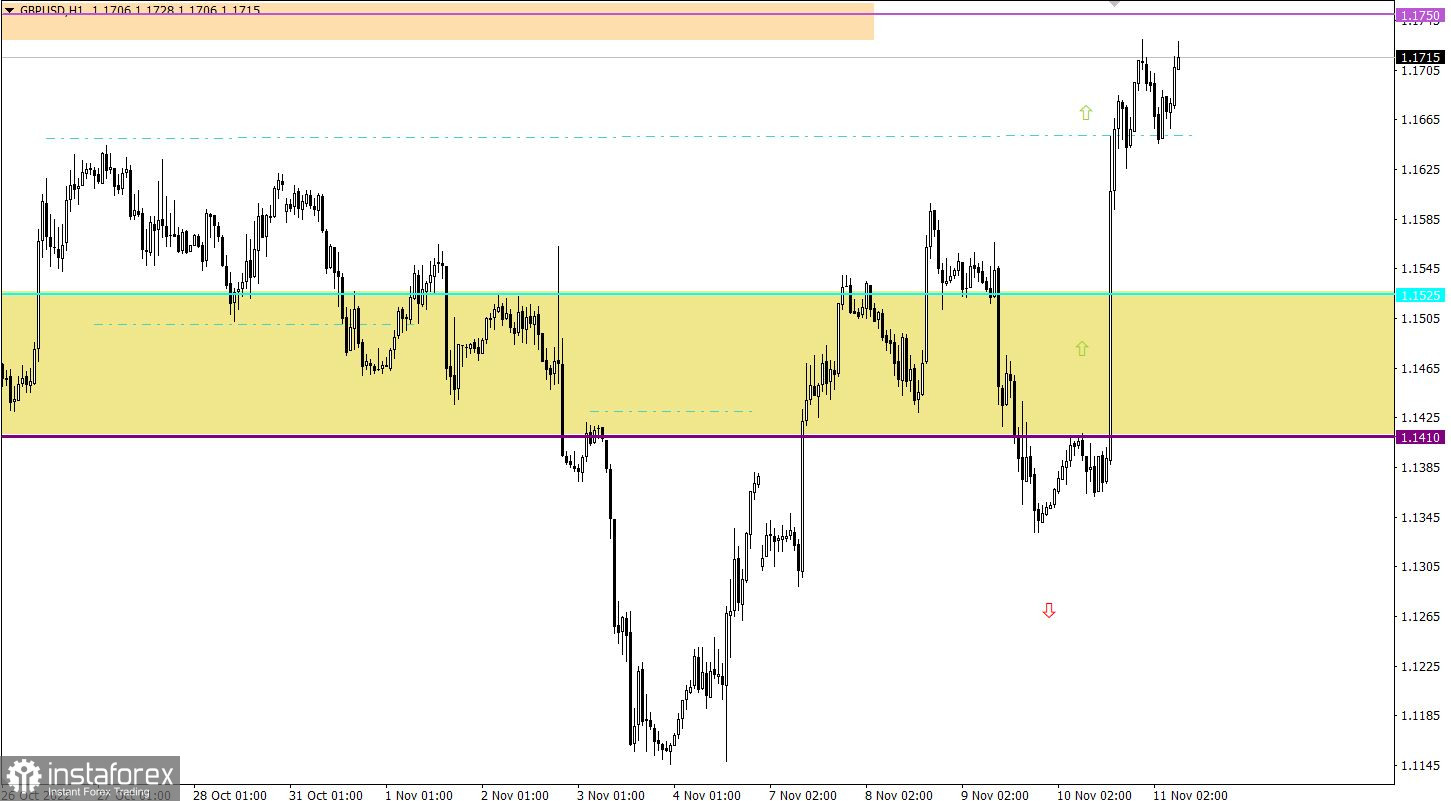
The GBPUSD currency pair gained more than 350 points. This strong inertial move led to a control tracking of the price with subsequent resistance levels at 1.1750.

Since the opening of the European session, statistics for the UK have been published, which came out better than forecasts. The final estimate of GDP for the 3rd quarter reflected a slowdown in the economy from 4.40% to 2.40%, with forecast of 2.10%. Meanwhile, industrial production decline is slowing down from -4.3% to -3.1%, although indicators were assumed to remain at the same level.
As a result, the pound sterling, overbought in recent days, continues to hold its positions in the market.
The inertial upward move led to a clear overheating of long positions on the euro in the short and intraday periods, which may indicate the possibility of a technical pullback. At the same time, speculators are still charged in the market, which may lead to ignoring technical overbought signals.
In this situation, stable holding of the price above 1.0200 in the daily period is considered an important technical point since this may indicate a phased shift in trade interests.
In this situation, the technical signal of the British currency being overbought is still present on the market. For this reason, traders are considering the scenario of a price pullback from the resistance level of 1.1750.
As for the subsequent upward cycle, it will be considered by market participants in case of stable price retention above the 1.1750 mark. With this development, the overbought signal will be ignored by traders.
A candlestick chart view is graphical rectangles of white and black light, with sticks on top and bottom. When analyzing each candle in detail, you will see its characteristics of a relative period: the opening price, closing price, and maximum and minimum prices.
Horizontal levels are price coordinates, relative to which a stop or a price reversal may occur. These levels are called support and resistance in the market.
Circles and rectangles are highlighted examples where the price of the story unfolded. This color selection indicates horizontal lines that may put pressure on the quote in the future.
The up/down arrows are the reference points of the possible price direction in the future.
*Phân tích thị trường được đăng tải ở đây có nghĩa là để gia tăng nhận thức của bạn, nhưng không đưa ra các chỉ dẫn để thực hiện một giao dịch.
InstaSpot analytical reviews will make you fully aware of market trends! Being an InstaSpot client, you are provided with a large number of free services for efficient trading.


