


Borussia là một trong những câu lạc bộ bóng đá danh giá nhất nước Đức, đã nhiều lần chứng minh cho người hâm mộ thấy: tinh thần thi đấu và sự lãnh đạo chắc chắn sẽ dẫn đến thành công. Giao dịch theo cách mà các chuyên gia thể thao chơi trò chơi: tự tin và chủ động. Giữ một "đường chuyền" từ Borussia FC và dẫn đầu với InstaSpot!


Đội ngũ của chúng tôi có hơn 7,000,000 thương nhân!
Hàng ngày chúng tôi làm việc cùng nhau để cải thiện việc giao dịch. Chúng tôi nhận được kết quả cao và luôn tiến lên phía trước.
Sự công nhận của hàng triệu thương nhân trên toàn thế giới là sự đánh giá tốt nhất cho công việc của chúng tôi! Bạn đã đưa ra quyết định của mình và chúng tôi sẽ làm mọi thứ cần thiết để đáp ứng mong đợi của bạn!
Chúng ta cùng với nhau sẽ là một nhóm tuyệt vời!
InstaSpot. Tự hào làm việc cho bạn!
Monday, as usual, is accompanied by an empty macroeconomic calendar. Important statistics in Europe, the United Kingdom, and the United States were not published.
In this regard, investors and traders have been focused on monitoring the information flow.
The main financial topics discussed in the media:
• The Bank of England is doubling down on potential bond buybacks as the contingency plan draws to a close.
• Fed officials Charles Evans and Lael Brainard continue to point to high inflation. At the same time, they mentioned in their speech that soon it will be necessary to limit the tightening of the monetary policy.
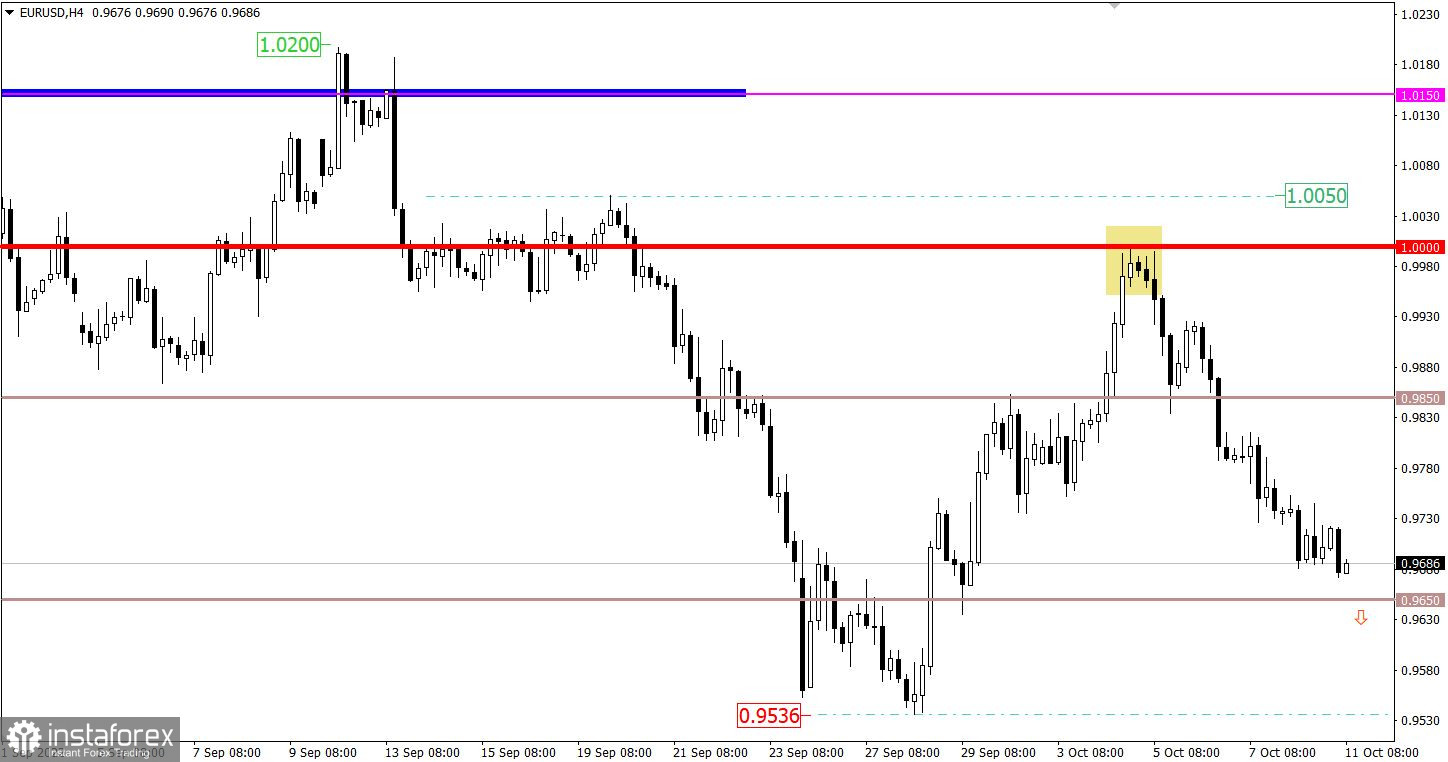
The EURUSD currency pair follows a downward trajectory from the parity level, which has recently played the role of resistance. Dollar positions have recovered by more than half relative to the recent correction.
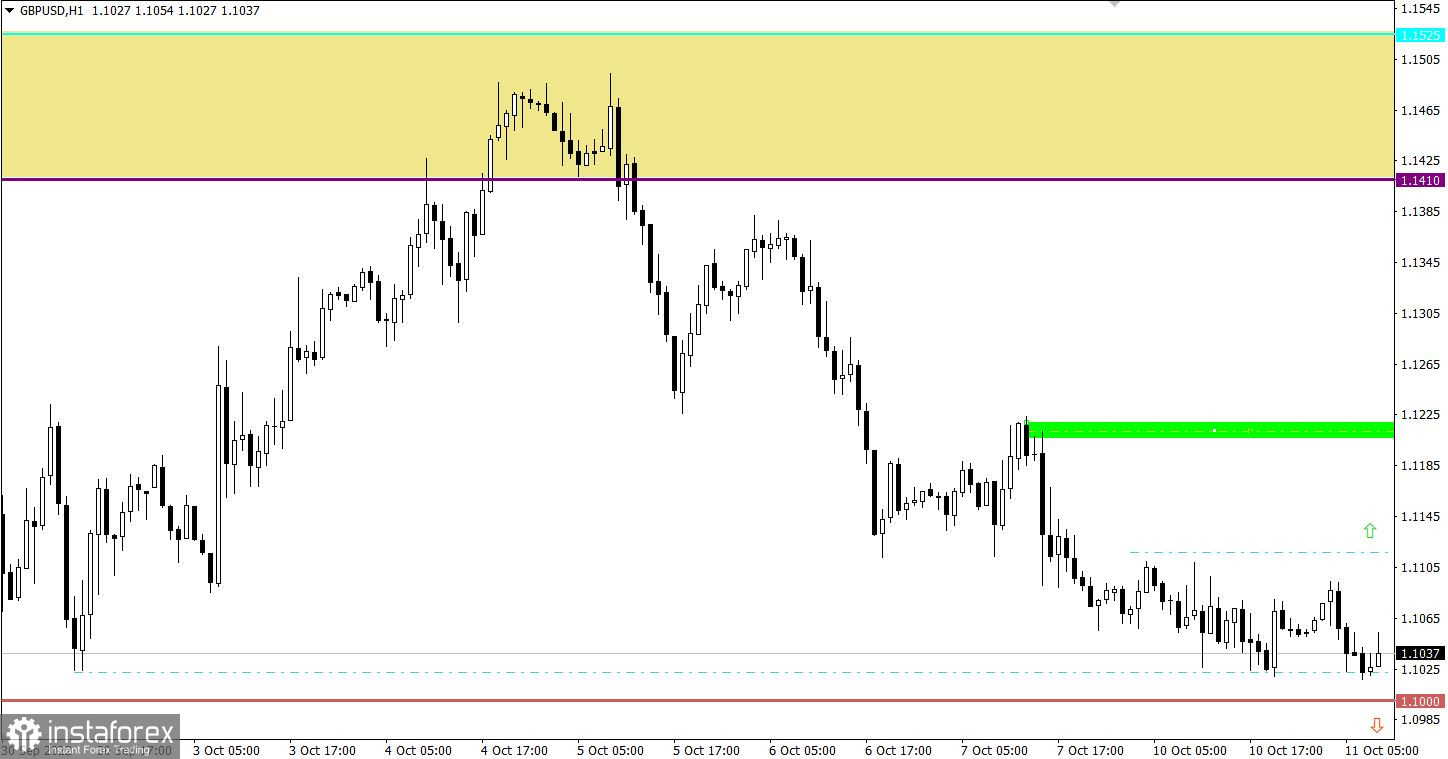
The GBPUSD currency pair has formed a downward trend from the 1.1410/1.1525 area. As a result, sellers have already managed to weaken the pound by more than 450 points. Relative to the previous day, the quote conditionally stood in one place, having a lateral amplitude within 100 points. On the one hand, the scale of 100 points may seem large, but within two weeks this is the lowest activity, which could play the role of the accumulation of trading forces.
Today, with the opening of the European session, data on the labor market in the UK was published. The unemployment rate fell from 3.6% to 3.5%, while employment in the country decreased by 109,000, which was expected to grow by 12,000. An additional factor that caused misunderstanding among investors is that the data for employment was for July, and unemployment was for August. With current figures, everything points to the fact that next month the unemployment data may be revised for the worse.
The downward cycle has already led to the weakening of the euro by more than 300 points since the middle of last week. This price move indicates a technical signal that the euro is oversold in the short term. Based on this, a pullback scenario with respect to the current downward cycle cannot be ruled out. The level 0.9650 serves as a support on the way of sellers.
As for the strengthening of the downward cycle, for this scenario, it is necessary to stay below the support level for at least a four-hour period. In this case, speculators will ignore technical oversold signals, and the quote will move towards the base of the downward trend.
In this situation, the stagnation was formed near the support level of 1.1000. Thus, for a downward scenario, the quote needs to stay below this level for at least a four-hour period. In this case, there will be a subsequent stage of recovery of dollar positions.
As for the upward scenario, the quote needs to stay above 1.1120 for it to be considered. With this outcome, a move towards 1.1220 is possible.
A candlestick chart view is graphical rectangles of white and black light, with sticks on top and bottom. When analyzing each candle in detail, you will see its characteristics of a relative period: the opening price, closing price, and maximum and minimum prices.
Horizontal levels are price coordinates, relative to which a stop or a price reversal may occur. These levels are called support and resistance in the market.
Circles and rectangles are highlighted examples where the price of the story unfolded. This color selection indicates horizontal lines that may put pressure on the quote in the future.
The up/down arrows are the reference points of the possible price direction in the future.
*Phân tích thị trường được đăng tải ở đây có nghĩa là để gia tăng nhận thức của bạn, nhưng không đưa ra các chỉ dẫn để thực hiện một giao dịch.
InstaSpot analytical reviews will make you fully aware of market trends! Being an InstaSpot client, you are provided with a large number of free services for efficient trading.


