


Huyền thoại trong nhóm InstaSpot!
Huyền thoại! Bạn nghĩ rằng đó là lời nói khoa trương? Nhưng chúng ta nên gọi một người đàn ông như thế nào, người đã trở thành người châu Á đầu tiên giành chức vô địch cờ vua thế giới lứa tuổi thiếu niên năm 18 tuổi và người trở thành Đại kiện tướng Ấn Độ đầu tiên năm 19 tuổi? Đó là khởi đầu cho con đường khó khăn đến danh hiệu Vô địch Thế giới của Viswanathan Anand, người đàn ông đã trở thành một phần của lịch sử cờ vua mãi mãi. Giờ đây, một huyền thoại nữa trong nhóm InstaSpot!


Borussia là một trong những câu lạc bộ bóng đá danh giá nhất nước Đức, đã nhiều lần chứng minh cho người hâm mộ thấy: tinh thần thi đấu và sự lãnh đạo chắc chắn sẽ dẫn đến thành công. Giao dịch theo cách mà các chuyên gia thể thao chơi trò chơi: tự tin và chủ động. Giữ một "đường chuyền" từ Borussia FC và dẫn đầu với InstaSpot!
Data on the European manufacturing sector came out worse than the preliminary estimate. The index fell during the period of September from 49.6 to 48.4, despite the expected decline to 48.5 points.
In the United Kingdom, manufacturing PMI for September rose from 47.3 to 48.4 but was predicted to rise to 48.5 points.
Meanwhile, the United States manufacturing PMI rose to 52.0 from 51.5, with forecast growth of 51.8.
There was no market reaction to the statistical data for the reason that all the attention of traders was focused on the information and news flow.
So the leverage for speculators was the rumor that the UK intends to cancel the plan to reduce the tax rate from 45% to 40%. This rumor was subsequently confirmed by UK Finance Minister Kwasi Kwarteng via Twitter.
"We get it, and we have listened," he wrote.
Based on this information, there was speculative interest in the position of the pound sterling, which locally jumped in value by 180 points, pulling the euro along with it.
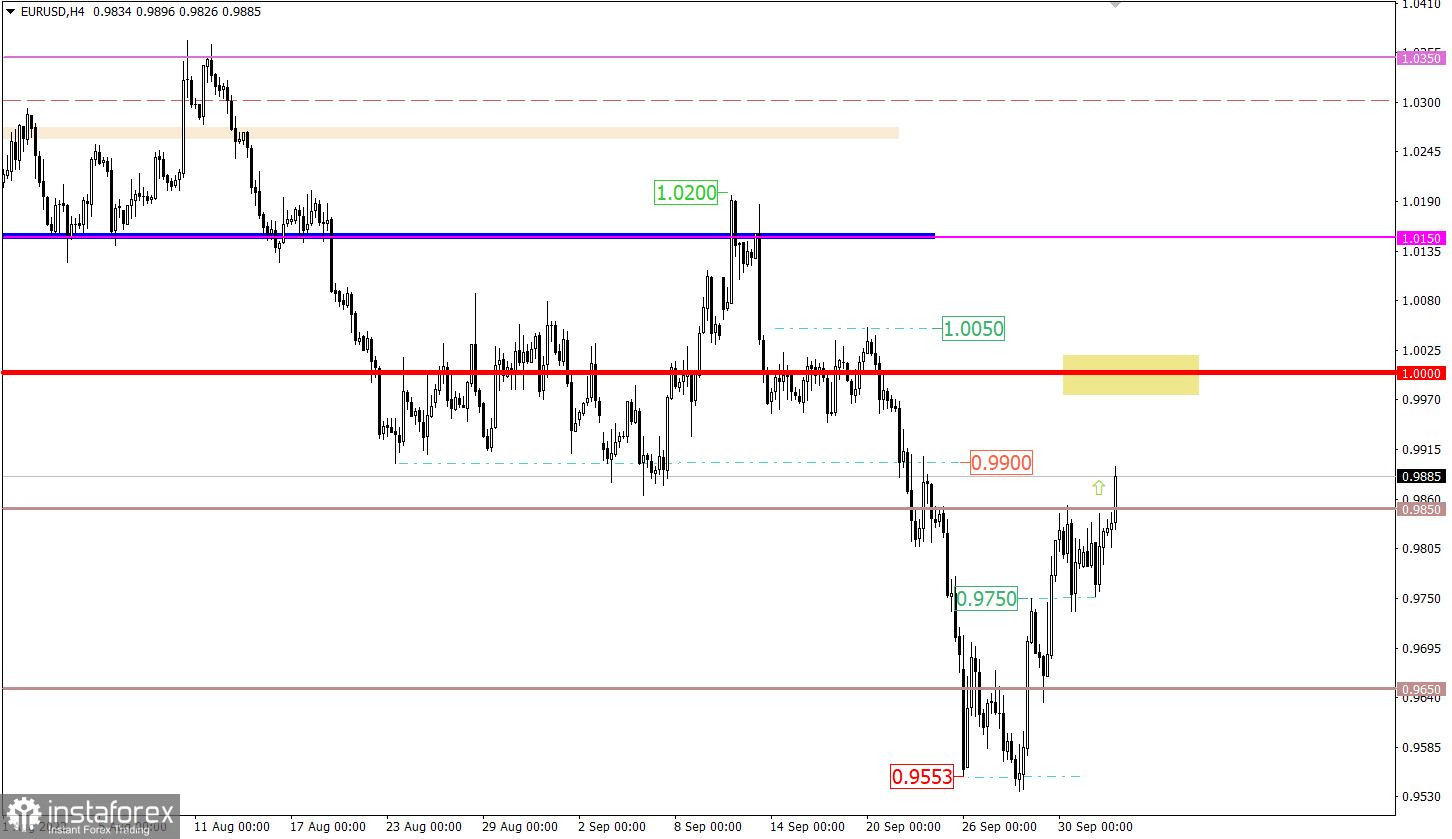
The EURUSD currency pair, during the corrective movement, reached the resistance level of 0.9850, relative to which there was a reduction in the volume of long positions on the euro. As a result, there was a rebound in the market, which eventually turned into stagnation within the 0.9750/0.9850 range.
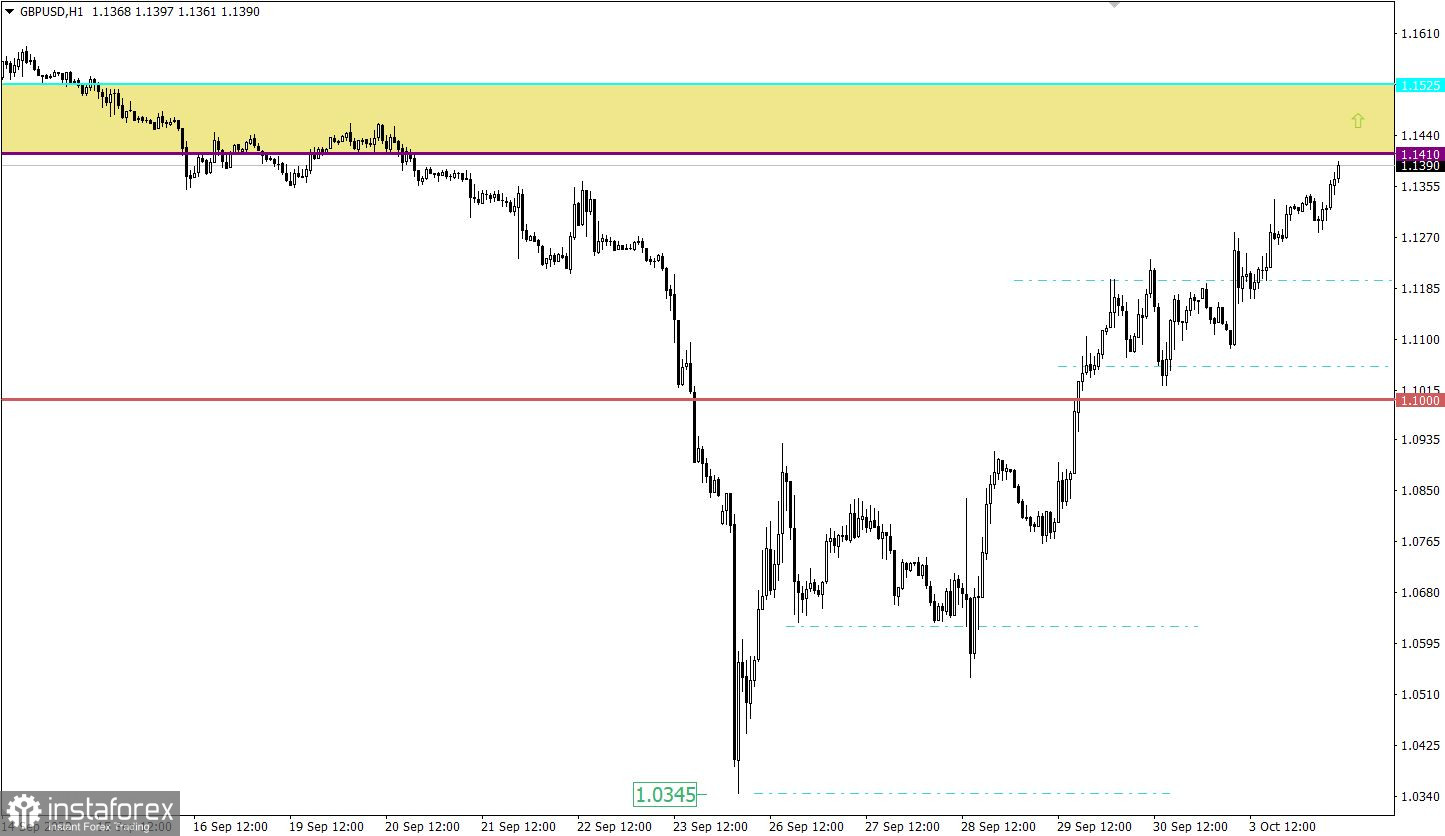
The GBP/USD currency pair continued to form a corrective move from the local low of the downward trend. As a result, in about a week, the British currency recovered its value by 10%, which is more than 1,000 points.

Today, the euro may receive support from buyers as producer prices in the EU may accelerate from 37.9% to 43.6%. That is, with such data, inflation in Europe will continue to grow, which will lead to further tightening of the ECB's monetary policy. That is, interest rates will continue to rise.
During the American trading session, data on the Job Openings and Labor Turnover Survey (JOLTS) for August in the United States will be published, which is expected to decline. This is a negative factor in the labor market.
Time targeting:
EU Producer Price Index (Aug) – 09:00 UTC
US JOLTS Job Openings (Aug) – 14:00 UTC
With the opening of European platforms, a breakdown of the upper limit of stagnation occurred. This step led to the prolongation of the corrective move in the market. A stable hold of the price above 0.9850 may eventually lead to a move towards parity.
Despite such impressive price changes, which herald a technical overbought signal, the pound still has an upside margin. For this reason, holding the price above the level of 1.1410 in a four-hour period may lead to a subsequent increase in the volume of long positions. This process will lead to the prolongation of the current cycle.
If the level area of 1.1410 has a proper impact on sellers, then the first thing that will occur is a slowdown, relative to which a reverse price movement will be considered.
A candlestick chart view is graphical rectangles of white and black light, with sticks on top and bottom. When analyzing each candle in detail, you will see its characteristics of a relative period: the opening price, closing price, and maximum and minimum prices.
Horizontal levels are price coordinates, relative to which a stop or a price reversal may occur. These levels are called support and resistance in the market.
Circles and rectangles are highlighted examples where the price of the story unfolded. This color selection indicates horizontal lines that may put pressure on the quote in the future.
The up/down arrows are the reference points of the possible price direction in the future.
*Phân tích thị trường được đăng tải ở đây có nghĩa là để gia tăng nhận thức của bạn, nhưng không đưa ra các chỉ dẫn để thực hiện một giao dịch.
InstaSpot analytical reviews will make you fully aware of market trends! Being an InstaSpot client, you are provided with a large number of free services for efficient trading.


