


Huyền thoại trong nhóm InstaSpot!
Huyền thoại! Bạn nghĩ rằng đó là lời nói khoa trương? Nhưng chúng ta nên gọi một người đàn ông như thế nào, người đã trở thành người châu Á đầu tiên giành chức vô địch cờ vua thế giới lứa tuổi thiếu niên năm 18 tuổi và người trở thành Đại kiện tướng Ấn Độ đầu tiên năm 19 tuổi? Đó là khởi đầu cho con đường khó khăn đến danh hiệu Vô địch Thế giới của Viswanathan Anand, người đàn ông đã trở thành một phần của lịch sử cờ vua mãi mãi. Giờ đây, một huyền thoại nữa trong nhóm InstaSpot!


Borussia là một trong những câu lạc bộ bóng đá danh giá nhất nước Đức, đã nhiều lần chứng minh cho người hâm mộ thấy: tinh thần thi đấu và sự lãnh đạo chắc chắn sẽ dẫn đến thành công. Giao dịch theo cách mà các chuyên gia thể thao chơi trò chơi: tự tin và chủ động. Giữ một "đường chuyền" từ Borussia FC và dẫn đầu với InstaSpot!
Details of the economic calendar for September 9
The week ended with an empty macroeconomic calendar. Important statistics in Europe, the United Kingdom, and the United States were not published.
Despite the absence of statistical data on Friday, the market continued to show speculative activity. Probably, traders were playing back the decision of the ECB to tighten its own policy.
Analysis of trading charts from September 9
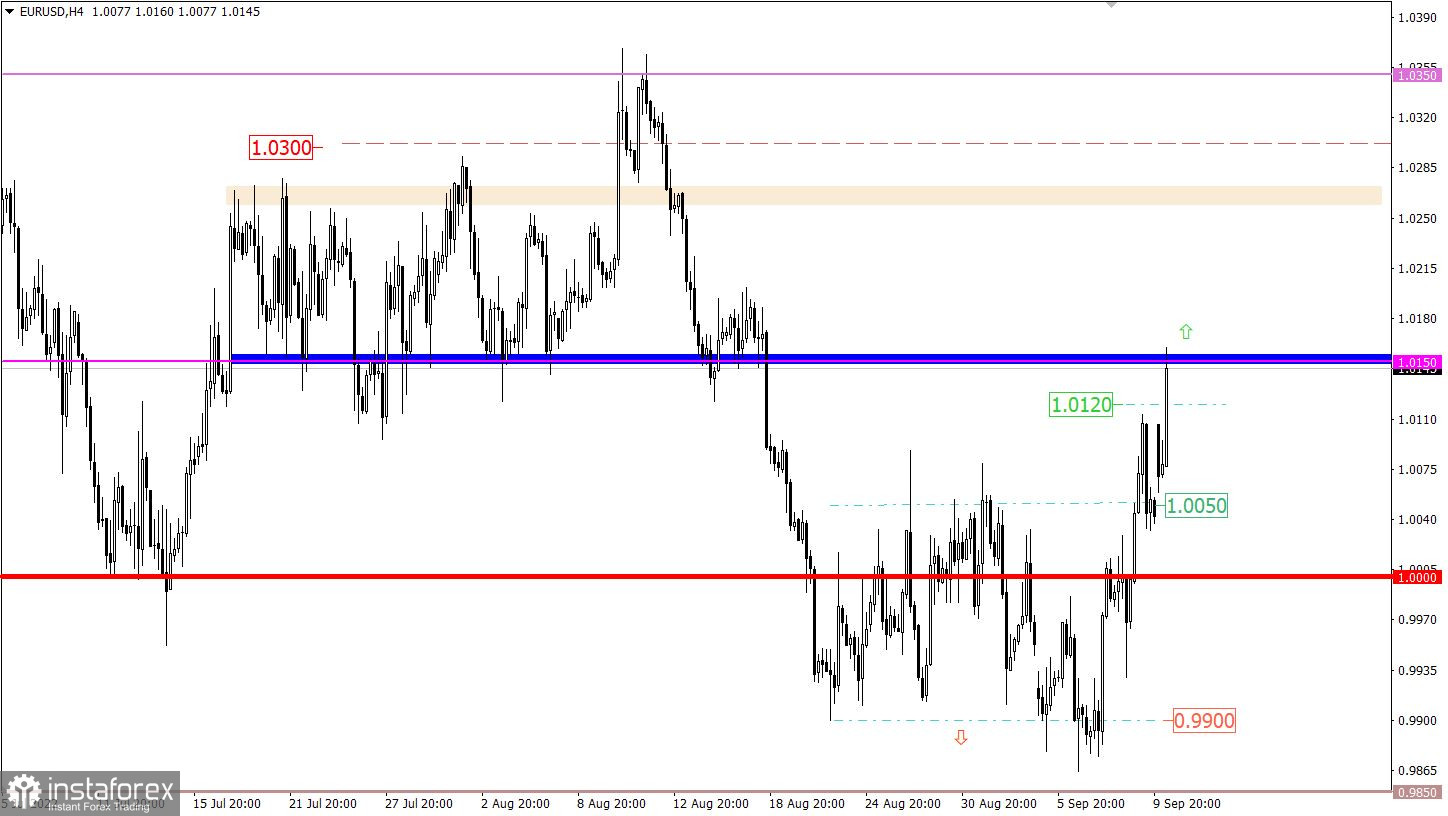
The EUR/USD currency pair strengthened its position during the past week. As a result, the quote went above the two-week range of 0.9900/1.0050.
The cause and effect of the upward cycle lies in the results of the ECB meeting, released last Thursday.
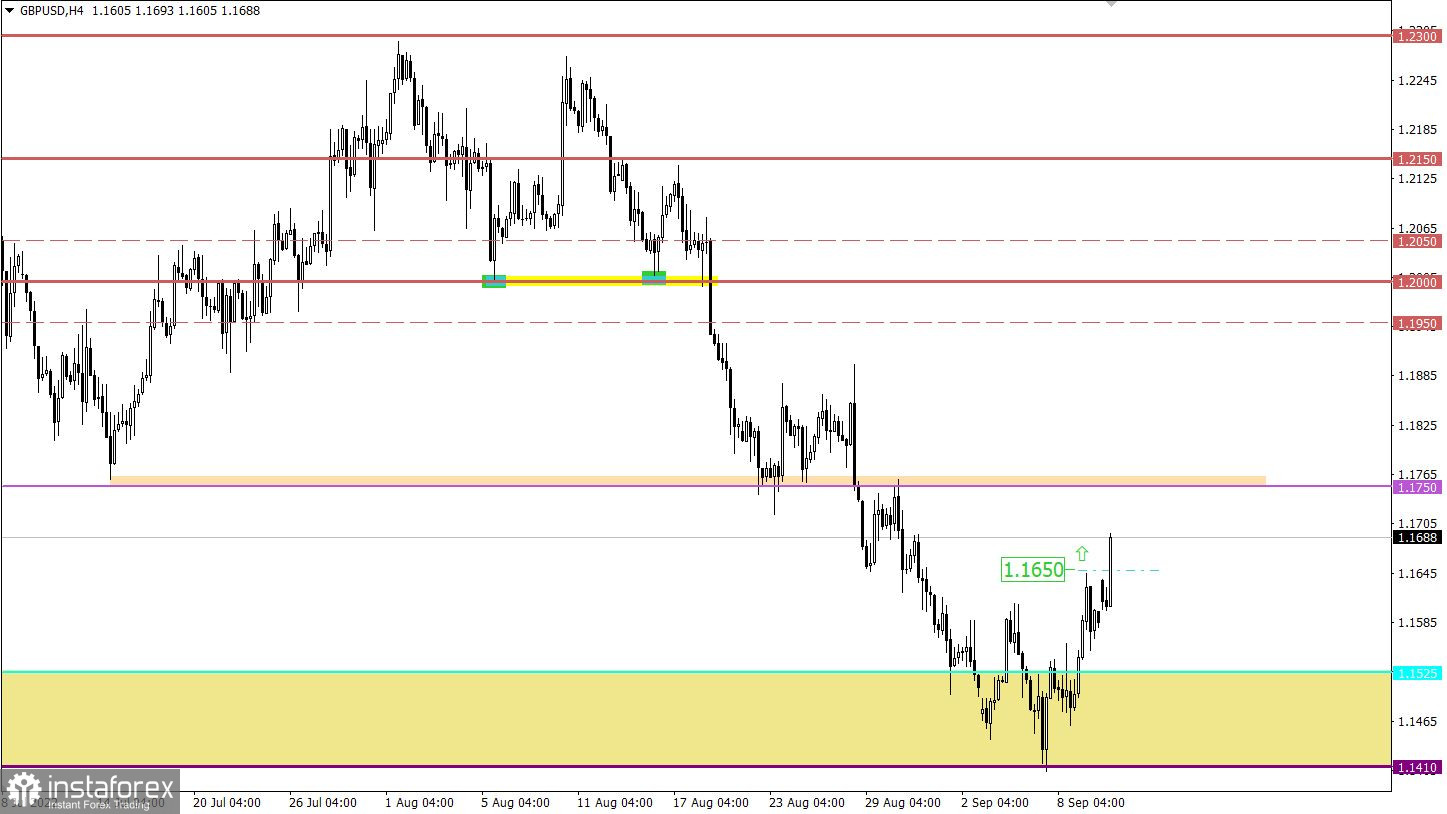
The GBP/USD currency pair gained about 230 points (about 2%) in less than a week. The level of the local low of 2020 (1.1410) serves as a support in the corrective movement.
Economic calendar for September 12
At the opening of the European session, data on UK industrial production was published, which slowed down from 2.4% to 1.1%. This is a negative factor for the country's economy, but based on the trading schedule and the market's reaction to statistical indicators, the pound sterling ignores them.
Important statistics in Europe and the United States are not expected today. However, it is worth paying attention to the sppeches of the representatives of the ECB.
Earlier, interesting statements were already received from representatives of the ECB, which indicate that the regulator should act tougher.
Joachim Nagel (ECB):
- Inflation in Europe could rise above 10% by December.
- The ECB needs to act more aggressively if necessary.
- A recession is possible in Europe.
Klaas Knot (ECB):
- The regulator needs to be more decisive if the situation requires it.
- Some economists have already started talking about a 0.75% rate hike in October.
Yannis Stournaras (ECB):
The ECB has not yet raised the rate to a neutral level. We need to raise it to this level faster. The neutral rate level can be within 1.5%–2%.
Trading plan for EUR/USD on September 12
Since the opening of the new trading week, an upward gap of about 60 points has appeared. This price gap brought the quote back to the highs of last week. With the opening of the European session, the upward cycle accelerated, which led to a move above the 1.0150 level. In this situation, a price impulse of more than 100 points in a short period of time can lead to overheating of long positions in short time periods. This may lead to a technical pullback. At the same time, stable price retention above the 1.0150 mark allows for the subsequent formation of a correction for dollar positions.
Trading plan for GBP/USD on September 12
There is also an upward gap in the pound, which returned the quote to the high of last week. Subsequently, there was a prolongation of the correction course, where the cycles are similar to the movement of the EURUSD pair. Stable price retention above 1.1650 will eventually lead to an increase in the value of the pound to at least 1.1750.
What is shown in the trading charts?
A candlestick chart view is graphical rectangles of white and black light, with sticks on top and bottom. When analyzing each candle in detail, you will see its characteristics of a relative period: the opening price, closing price, and maximum and minimum prices.
Horizontal levels are price coordinates, relative to which a stop or a price reversal may occur. These levels are called support and resistance in the market.
Circles and rectangles are highlighted examples where the price of the story unfolded. This color selection indicates horizontal lines that may put pressure on the quote in the future.
The up/down arrows are the reference points of the possible price direction in the future.
*Phân tích thị trường được đăng tải ở đây có nghĩa là để gia tăng nhận thức của bạn, nhưng không đưa ra các chỉ dẫn để thực hiện một giao dịch.
InstaSpot analytical reviews will make you fully aware of market trends! Being an InstaSpot client, you are provided with a large number of free services for efficient trading.


