


Đội ngũ của chúng tôi có hơn 7,000,000 thương nhân!
Hàng ngày chúng tôi làm việc cùng nhau để cải thiện việc giao dịch. Chúng tôi nhận được kết quả cao và luôn tiến lên phía trước.
Sự công nhận của hàng triệu thương nhân trên toàn thế giới là sự đánh giá tốt nhất cho công việc của chúng tôi! Bạn đã đưa ra quyết định của mình và chúng tôi sẽ làm mọi thứ cần thiết để đáp ứng mong đợi của bạn!
Chúng ta cùng với nhau sẽ là một nhóm tuyệt vời!
InstaSpot. Tự hào làm việc cho bạn!


Diễn viên, nhà vô địch mùa giải UFC 6 và là người hùng thật sự!
Người tự mình làm nên tất cả. Người đàn ông đáng kể học hỏi.
Bí mật đằng sau thành công của Taktarov là sự cố gắng liên tục hướng tới mục tiêu.
Hãy khai phá tất cả các mặt tài năng của bạn!
Khám phá, thử, thất bại - nhưng không bao giờ dừng lại!
InstaSpot. Câu chuyện thành công của bạn bắt đầu từ đây!
Details of the economic calendar for August 12
UK GDP data for the second quarter showed a slowdown in economic growth from 8.7% to 2.9%. In other words, the British economy is steadily slipping into recession, as the Bank of England recently warned.
Eurozone industrial production posted a gain of 2.4% YoY, with a forecast of 0.8% YoY.
With the euro and pound sterling overheating in the short term, the statistics were needlessly ignored.
Analysis of trading charts from August 12
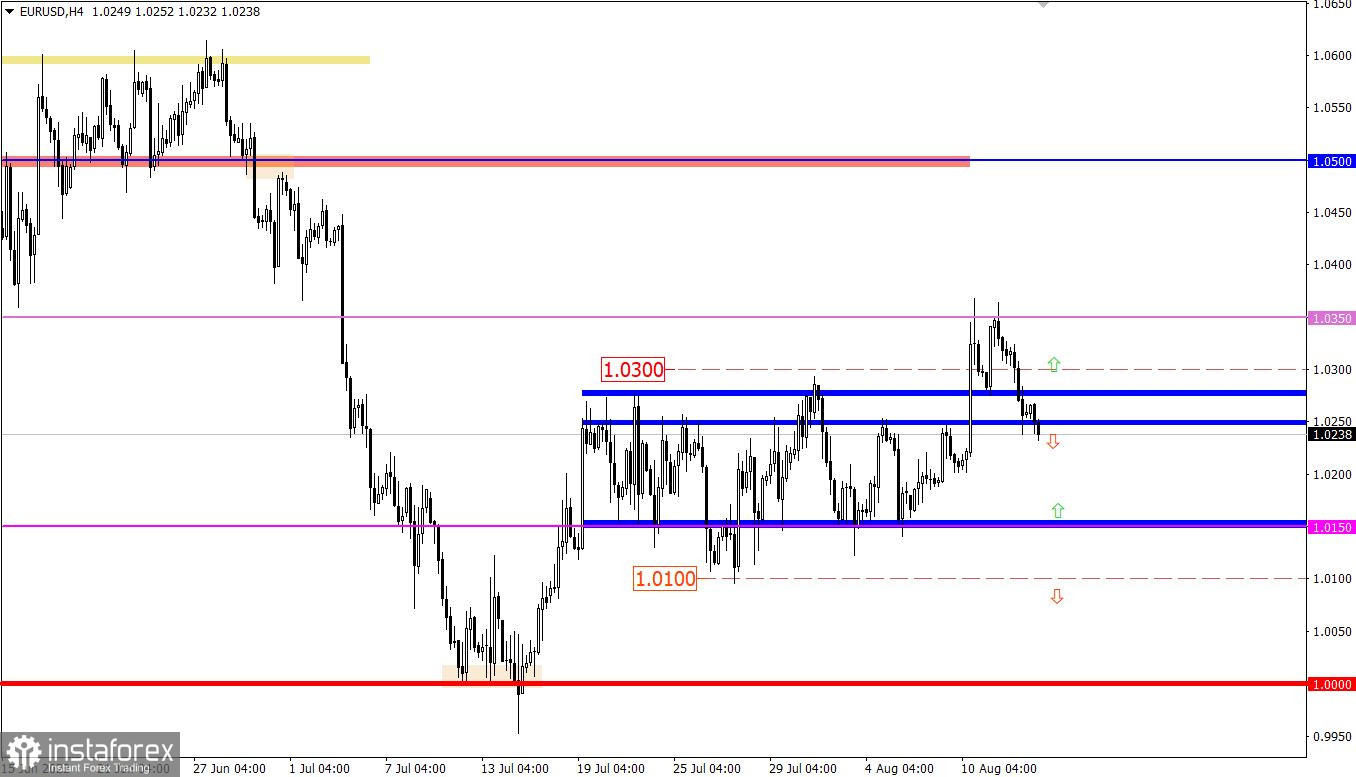
The EURUSD currency pair rebounded from the resistance level of 1.0350 last week. As a result, a phased increase in the volume of dollar positions appeared on the market, which led to the price returning to the border of the previously passed flat 1.0150/1.0270.
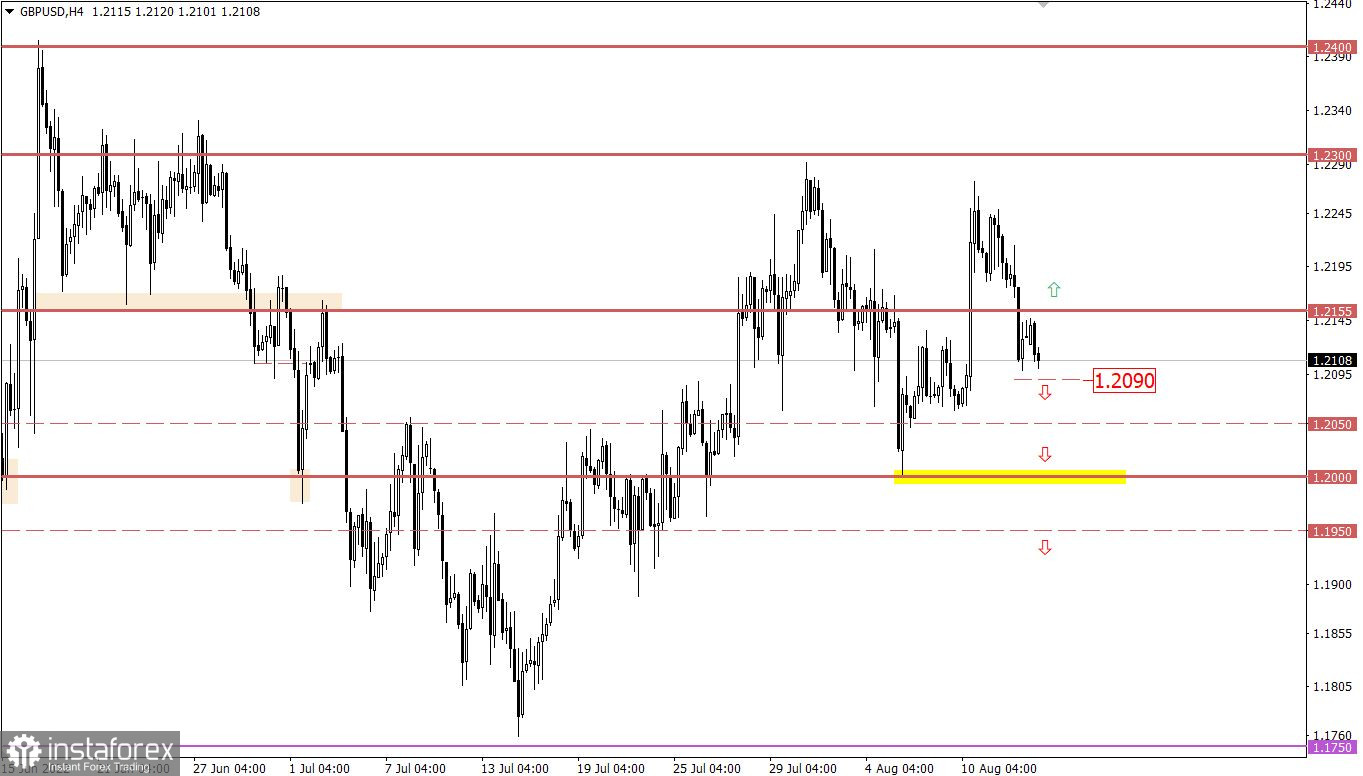
The GBPUSD currency pair overcame the level of 1.2155 from top to bottom during the intensive movement. As a result, dollar positions managed to recover relative to their decline during the middle of last week.

Economic calendar for August 15
Monday is traditionally accompanied by an empty macroeconomic calendar. Important statistics in Europe, the United Kingdom, and the United States are not expected.
In this regard, investors and traders will focus on the information flow, and work out technical analysis.
Trading plan for EUR/USD on August 15
The formation of a downward cycle may accelerate if the price holds below 1.0200. In this case, touching the level of 1.0150 will be considered a real prospect in the market.
An alternative scenario considers variable price fluctuations around 1.0250/1.0270, which will cool the ardor of euro sellers. The signal for the growth of long positions will appear after the price holds above 1.0300.
Trading plan for GBP/USD on August 15
In this situation, interest in dollar positions is still relevant in the market. For this reason, keeping the price below 1.2090 may lead to a movement towards the area of the psychological level 1.2000 (1.2050).
Traders can consider an alternative scenario if the price returns above 1.2160 in a four-hour period. In this case, the downward cycle may break.
What is shown in the trading charts?
A candlestick chart view is graphical rectangles of white and black light, with sticks on top and bottom. When analyzing each candle in detail, you will see its characteristics of a relative period: the opening price, closing price, and maximum and minimum prices.
Horizontal levels are price coordinates, relative to which a stop or a price reversal may occur. These levels are called support and resistance in the market.
Circles and rectangles are highlighted examples where the price of the story unfolded. This color selection indicates horizontal lines that may put pressure on the quote in the future.
The up/down arrows are the reference points of the possible price direction in the future.
*Phân tích thị trường được đăng tải ở đây có nghĩa là để gia tăng nhận thức của bạn, nhưng không đưa ra các chỉ dẫn để thực hiện một giao dịch.
InstaSpot analytical reviews will make you fully aware of market trends! Being an InstaSpot client, you are provided with a large number of free services for efficient trading.


