


Đội ngũ của chúng tôi có hơn 7,000,000 thương nhân!
Hàng ngày chúng tôi làm việc cùng nhau để cải thiện việc giao dịch. Chúng tôi nhận được kết quả cao và luôn tiến lên phía trước.
Sự công nhận của hàng triệu thương nhân trên toàn thế giới là sự đánh giá tốt nhất cho công việc của chúng tôi! Bạn đã đưa ra quyết định của mình và chúng tôi sẽ làm mọi thứ cần thiết để đáp ứng mong đợi của bạn!
Chúng ta cùng với nhau sẽ là một nhóm tuyệt vời!
InstaSpot. Tự hào làm việc cho bạn!


Diễn viên, nhà vô địch mùa giải UFC 6 và là người hùng thật sự!
Người tự mình làm nên tất cả. Người đàn ông đáng kể học hỏi.
Bí mật đằng sau thành công của Taktarov là sự cố gắng liên tục hướng tới mục tiêu.
Hãy khai phá tất cả các mặt tài năng của bạn!
Khám phá, thử, thất bại - nhưng không bao giờ dừng lại!
InstaSpot. Câu chuyện thành công của bạn bắt đầu từ đây!
Details of the economic calendar from August 2
During the American trading session, data on job openings in the United States was published, which decreased from 11.303 million to 10.69 million—this is significantly stronger than the forecast of 11.000 million. Such a negative factor was completely ignored by the markets. Perhaps the strong information background of China-Taiwan-US is to blame.
Analysis of trading charts from August 2
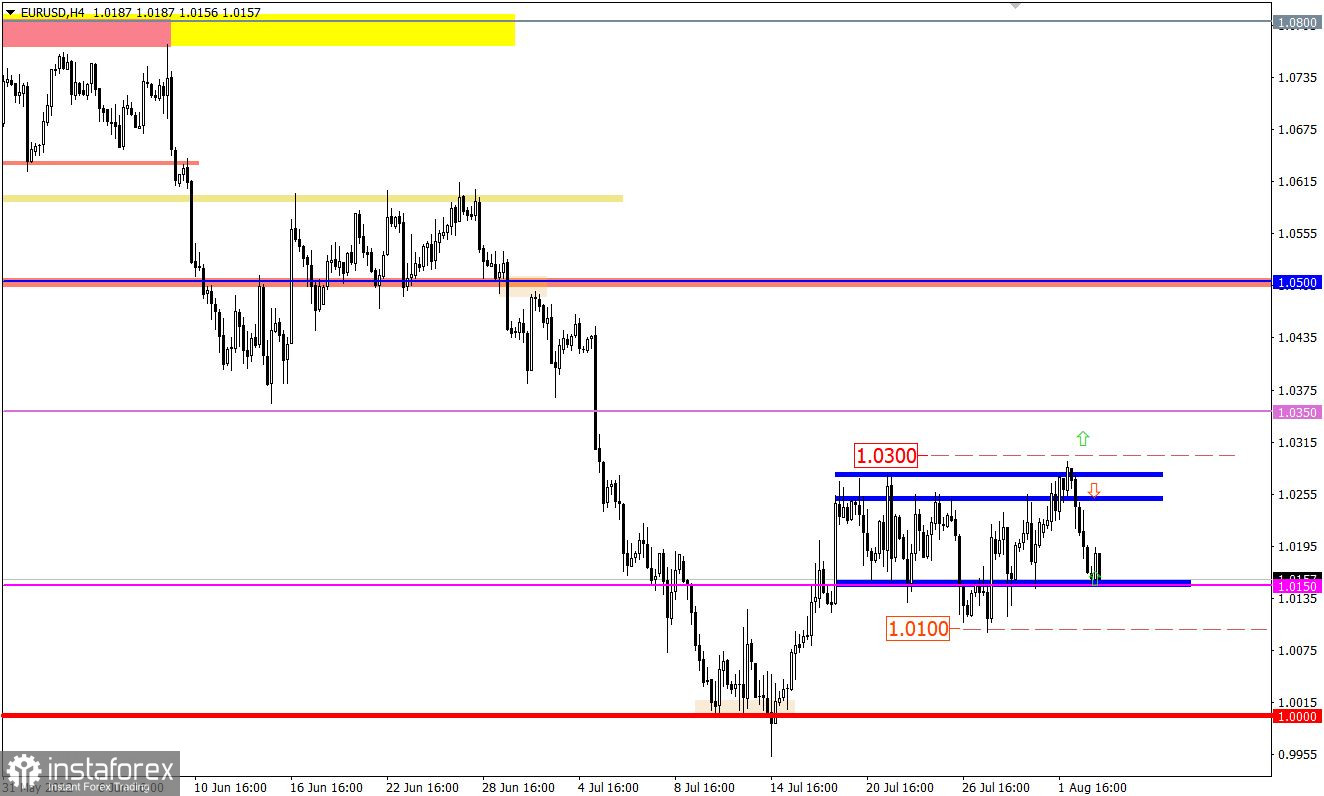
The EURUSD currency pair has been moving within the 1.0150/1.0270 side channel for the second week in a row, consistently fulfilling the set boundaries. During the past day there was an interest in dollar positions on the Forex market. As a result, the quote fell from 1.0270 to 1.0150, eventually completing the cycle from the upper to the lower border of the flat.
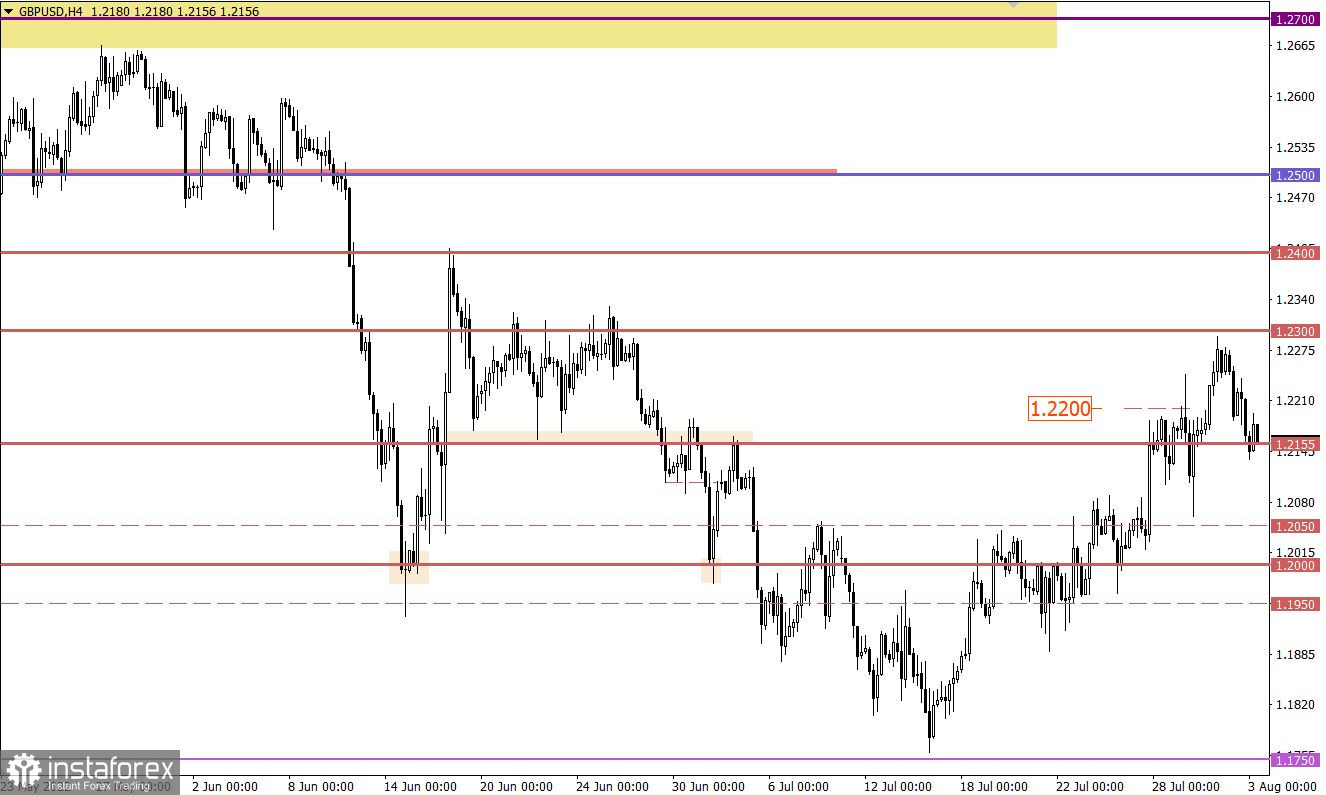
The GBPUSD currency pair slowed the construction of a corrective move in the area of the resistance level of 1.2300, where a characteristic price rebound appeared. As a result, a gradual increase in the volume of short positions appeared, based on which the quote returned to the value of 1.2155.

Economic calendar for August 3
The final data on the business activity index in the service sector, as well as indicators for the composite index in Europe, the United Kingdom, and the United States will be published today. However, as in the case of the manufacturing index, which was published on Monday, this will not affect the market in any way since the data should only confirm preliminary estimates. The market has already put them in the current quotes.
Time targeting:
EU Services PMI – 08:00 UTC
UK Services PMI – 08:30 UTC
US Services PMI – 13:45 UTC
Trading plan for EUR/USD on August 3
In this situation, traders are still focused on two main strategies: a rebound and a breakdown of the relative given flat boundaries.
Strategy details:
A rebound from one or another flat border considers local price movements. The work implies a moderate risk, at which it is possible to take part of the move from each cycle of building a flat.
In the case of breakdown tactics, special attention is paid to the values of 1.0300 in the upward scenario and 1.0100 in the downward market development. Confirmation of the signal should occur in a four-hour period in the form of price retention.
Trading plan for GBP/USD on August 3
Despite the local downward move, the current correction is still relevant in the market. For this reason, the return of the price above 1.2200 may well restart long positions, which will lead to a move towards the resistance level of 1.2300.
An alternative scenario considers the phased completion of the corrective move. At the same time, the development of holding the price below the value of 1.2120 will open the way to the psychological level of 1.2000.
What is reflected in the trading charts?
A candlestick chart view is graphical rectangles of white and black light, with sticks on top and bottom. When analyzing each candle in detail, you will see its characteristics of a relative period: the opening price, closing price, and maximum and minimum prices.
Horizontal levels are price coordinates, relative to which a stop or a price reversal may occur. These levels are called support and resistance in the market.
Circles and rectangles are highlighted examples where the price of the story unfolded. This color selection indicates horizontal lines that may put pressure on the quote in the future.
The up/down arrows are the reference points of the possible price direction in the future.
*Phân tích thị trường được đăng tải ở đây có nghĩa là để gia tăng nhận thức của bạn, nhưng không đưa ra các chỉ dẫn để thực hiện một giao dịch.
InstaSpot analytical reviews will make you fully aware of market trends! Being an InstaSpot client, you are provided with a large number of free services for efficient trading.


