


Huyền thoại trong nhóm InstaSpot!
Huyền thoại! Bạn nghĩ rằng đó là lời nói khoa trương? Nhưng chúng ta nên gọi một người đàn ông như thế nào, người đã trở thành người châu Á đầu tiên giành chức vô địch cờ vua thế giới lứa tuổi thiếu niên năm 18 tuổi và người trở thành Đại kiện tướng Ấn Độ đầu tiên năm 19 tuổi? Đó là khởi đầu cho con đường khó khăn đến danh hiệu Vô địch Thế giới của Viswanathan Anand, người đàn ông đã trở thành một phần của lịch sử cờ vua mãi mãi. Giờ đây, một huyền thoại nữa trong nhóm InstaSpot!


Borussia là một trong những câu lạc bộ bóng đá danh giá nhất nước Đức, đã nhiều lần chứng minh cho người hâm mộ thấy: tinh thần thi đấu và sự lãnh đạo chắc chắn sẽ dẫn đến thành công. Giao dịch theo cách mà các chuyên gia thể thao chơi trò chơi: tự tin và chủ động. Giữ một "đường chuyền" từ Borussia FC và dẫn đầu với InstaSpot!
Details of the economic calendar from August 1
The final data on business activity indices in Europe, the United Kingdom and the United States reflected a widespread decline, which coincides with the preliminary estimate.
Details of statistical indicators:
• In Europe, the manufacturing PMI fell from 52.0 to 49.3.
• In the UK, the situation is similar: manufacturing PMI fell from 52.8 to 52.1 points.
• The same statistics for the US were published during the American trading session: manufacturing PMI fell from 52.7 to 52.2 points.
Conclusion
To a greater extent, the market did not react in any way to the incoming statistical data due to the fact that they had already been taken into account by the market.
Analysis of trading charts from August 1
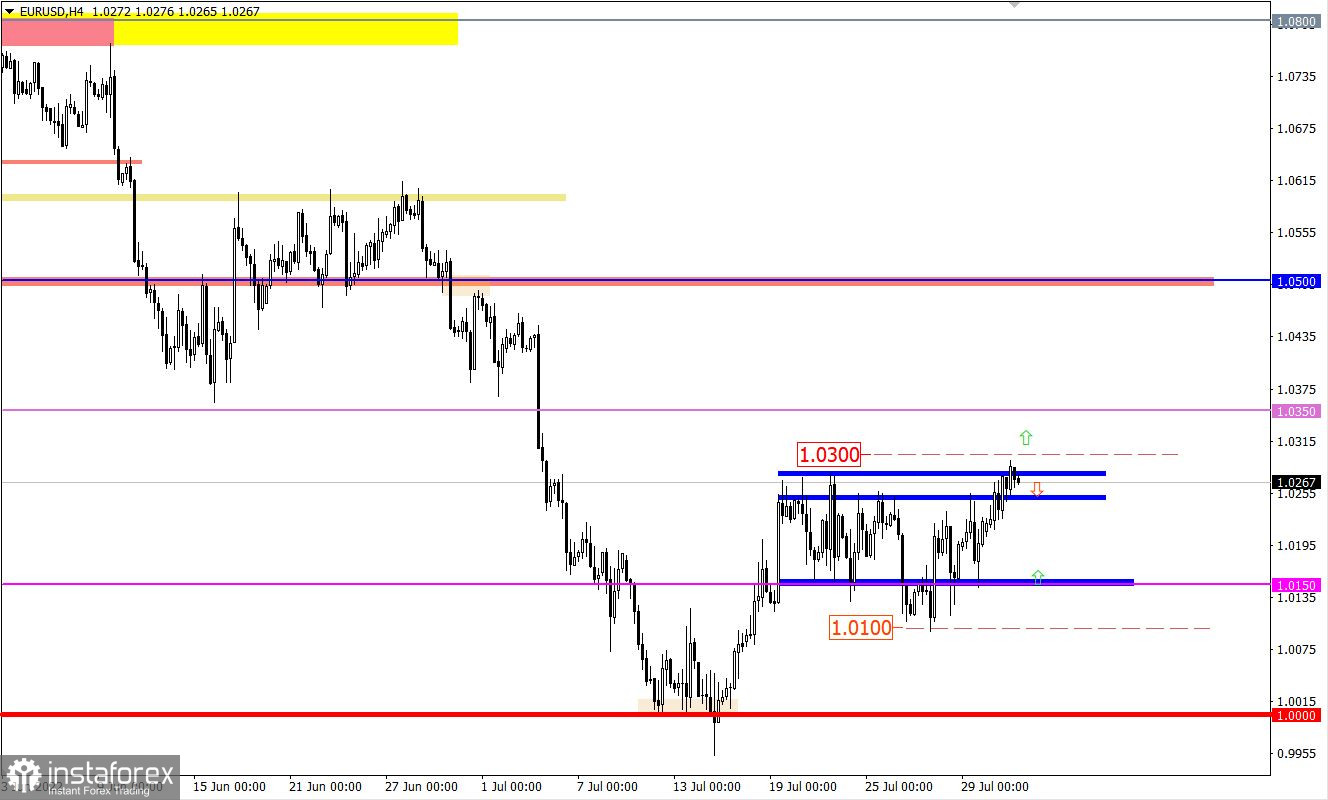
The EURUSD currency pair came close to the upper limit of the 1.0150/1.0270 side range with the intention of breaking it. There was no clear signal of the end of the flat since the price did not hold beyond the control value of 1.0300.
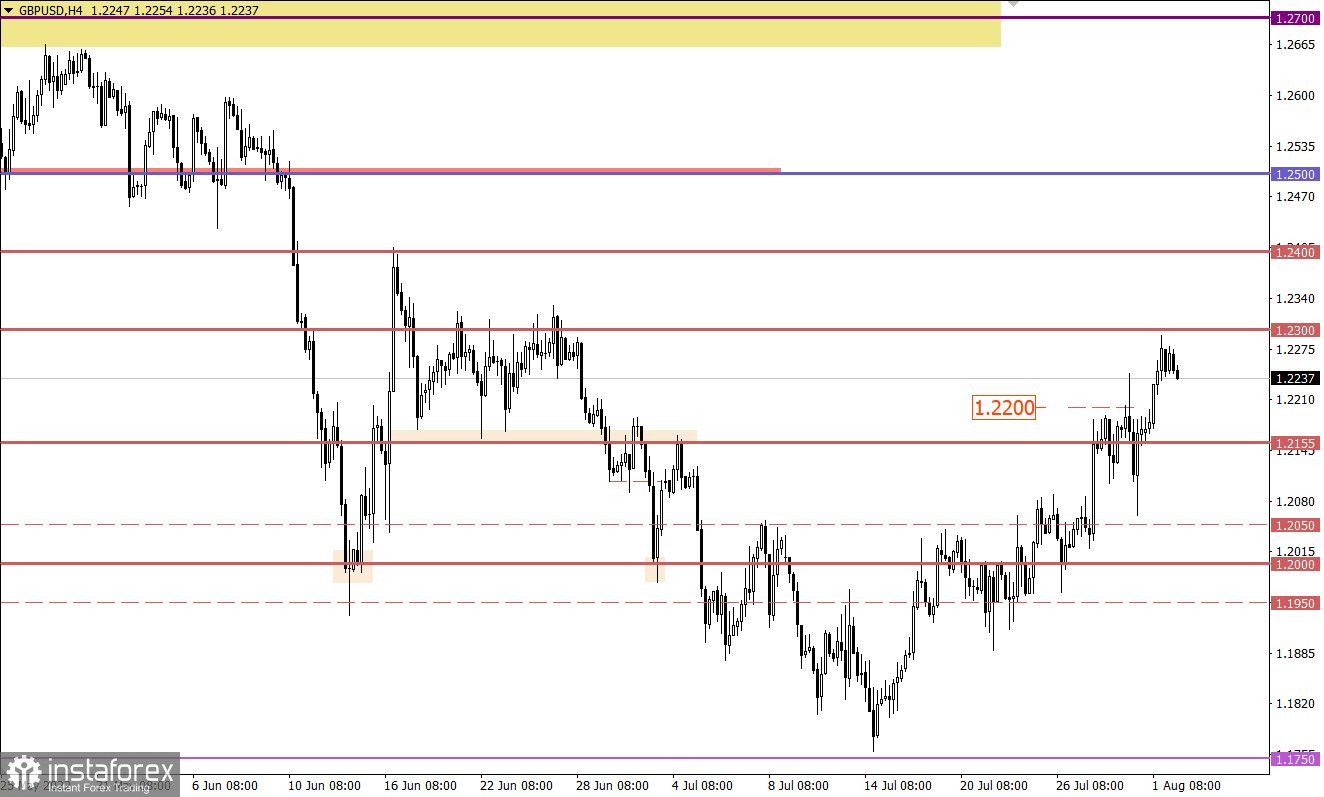
The GBPUSD currency pair managed to prolong the current corrective move after a short stop. This movement resulted for the rate to reach the first predicted value of 1.2300, where there was a reduction in the volume of long positions. The correction scale from the support level of 1.1750 is about 500 points, which all fits into the correction framework relative to the medium-term downward trend.

Economic calendar for August 2
During the American trading session, data on job openings in the United States will be published, which should decrease from 11.23 million to 11 million. This is a negative factor that may affect dollar positions.
Time targeting:
US JOLTS Job Openings – 14:00 UTC
Trading plan for EUR/USD on August 2
In this situation, only holding the price above 1.0300 in a four-hour period will increase the chances of buyers to complete the upside flat. Otherwise, we cannot exclude the scenario of a price rebound, where the current flat will continue to form.
Based on the technical picture, we concretize the above into trading signals:
A buy signal will be active after the price holds above 1.0300 in a four-hour period. In this case, a path will open in the direction of 1.0350–1.0500.
A signal to sell the euro will be considered by traders if the price returns below 1.0240. In this case, the current flat (1.0150/1.0270) will continue to form.
Trading plan for GBP/USD on August 2
Presumably, the level of 1.2300 will have a proper impact on sellers, stimulating them to increase the volume of short positions. In this case, the current correction may proceed to a phased completion or deceleration.
Traders will consider prolonging the correction if the price stays above 1.2340. In this case, the pound sterling may rush towards 1.2400.
Note that the primary signal of a change in trading interests will appear only after the price holds above 1.2400 in the daily period.
What is reflected in the trading charts?
A candlestick chart view is graphical rectangles of white and black light, with sticks on top and bottom. When analyzing each candle in detail, you will see its characteristics of a relative period: the opening price, closing price, and maximum and minimum prices.
Horizontal levels are price coordinates, relative to which a stop or a price reversal may occur. These levels are called support and resistance in the market.
Circles and rectangles are highlighted examples where the price of the story unfolded. This color selection indicates horizontal lines that may put pressure on the quote in the future.
The up/down arrows are the reference points of the possible price direction in the future.
*Phân tích thị trường được đăng tải ở đây có nghĩa là để gia tăng nhận thức của bạn, nhưng không đưa ra các chỉ dẫn để thực hiện một giao dịch.
InstaSpot analytical reviews will make you fully aware of market trends! Being an InstaSpot client, you are provided with a large number of free services for efficient trading.


