


Huyền thoại trong nhóm InstaSpot!
Huyền thoại! Bạn nghĩ rằng đó là lời nói khoa trương? Nhưng chúng ta nên gọi một người đàn ông như thế nào, người đã trở thành người châu Á đầu tiên giành chức vô địch cờ vua thế giới lứa tuổi thiếu niên năm 18 tuổi và người trở thành Đại kiện tướng Ấn Độ đầu tiên năm 19 tuổi? Đó là khởi đầu cho con đường khó khăn đến danh hiệu Vô địch Thế giới của Viswanathan Anand, người đàn ông đã trở thành một phần của lịch sử cờ vua mãi mãi. Giờ đây, một huyền thoại nữa trong nhóm InstaSpot!


Borussia là một trong những câu lạc bộ bóng đá danh giá nhất nước Đức, đã nhiều lần chứng minh cho người hâm mộ thấy: tinh thần thi đấu và sự lãnh đạo chắc chắn sẽ dẫn đến thành công. Giao dịch theo cách mà các chuyên gia thể thao chơi trò chơi: tự tin và chủ động. Giữ một "đường chuyền" từ Borussia FC và dẫn đầu với InstaSpot!
The first estimate of Eurozone GDP for the second quarter turned out to be slightly better than the forecast. Economic growth rates slowed from 5.4% to 4.0%, although a decline to 2.8% was expected. On the one hand, the data for the EU looks somewhat better than for the United States, but in any case, the dynamics clearly do not bode well.
At the same time as GDP, preliminary data on inflation were published in the eurozone, which again set a historical record, reaching 8.9% in July on an annualized basis. Inflation is rising, and the economy is slowing down, there are no clear signs of a recession yet, but they may appear soon.
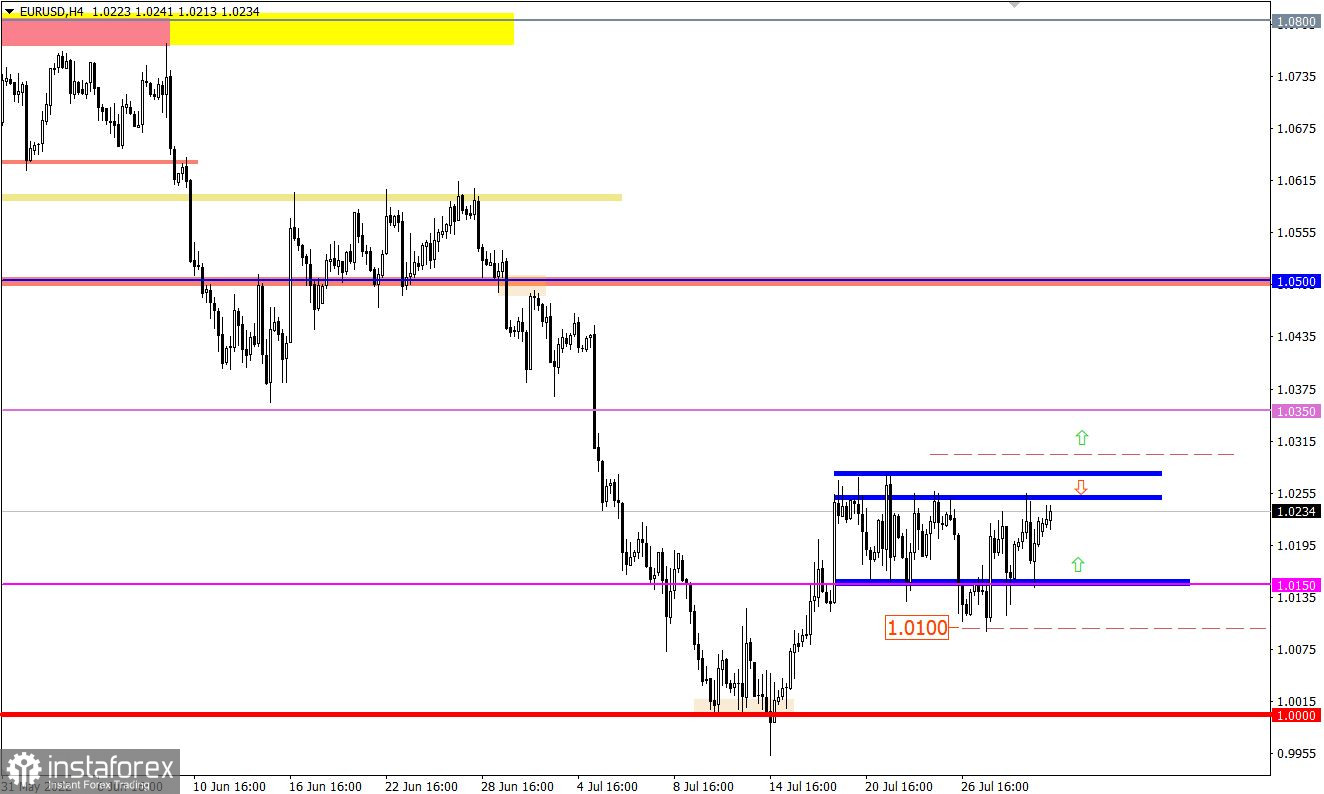
The EURUSD currency pair has been moving in the sideways range of 1.0150/1.0270 for the second week in a row, consistently fulfilling the set boundaries. Due to the long-term movement of the price within the sideways, the amplitude periodically shrinks, then expands, while the ambiguous mood of market participants remains.
On the trading chart of the daily period, there is a corrective move in the structure of the downward trend. The parity level area serves as a support.
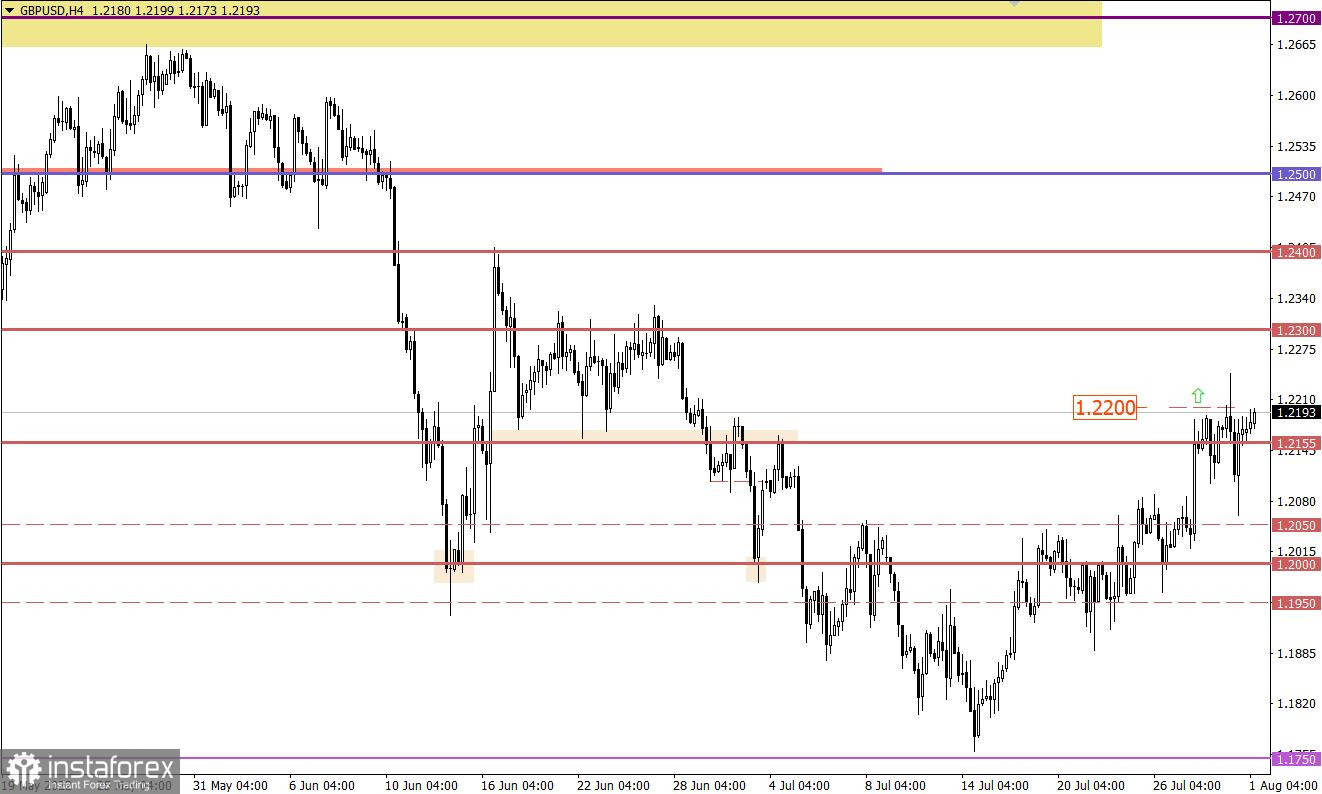
As for the GBPUSD currency pair, despite a series of speculative impulses, the quote is still moving at the peak of the corrective move. In about two weeks, the pound sterling appreciated in value by more than 450 points. This is a strong price change, but it still fits into the structure of the medium-term downward trend.

The final data on the index of business activity in the manufacturing sector in Europe, the United Kingdom and the United States will be published today, but probably these indicators will not cause any interest. The indices should only confirm the preliminary estimates that have already been taken into account by the market. In case of a strong discrepancy between the indicators and the preliminary assessment, speculators may react to them.
With the opening of the European session, data on retail sales in Germany have already been published, the rate of decline has only intensified. This is a negative factor, and another signal of economic problems in the EU.
Time targeting:
EU Manufacturing PMI – 08:00 UTC
UK Manufacturing PMI – 08:30 UTC
US Manufacturing PMI – 13:45 UTC
In this situation, the work of traders is based on two methods: a rebound or a breakdown relative to the given boundaries.
Let's consider each of these methods separately:
The rebound from the upper border of the flat takes into account the interaction of trading forces within the values of 1.0250/1.2070, where a quote reversal is possible. A rebound from the lower border considers the area of 1.0150.
In the case of the breakout method, special attention is paid to the values of 1.0300 in case of an upward scenario and 1.0100 when considering a downward cycle. It is worth noting that the signal must be confirmed in the form of holding the quote outside the control value for at least a four-hour period.
It can be assumed that the upward mood prevails in the market as indicated by the stable holding of the price above the level of 1.2155. If the given mood is maintained, the subsequent growth of the pound's value in the direction of 1.2300/1.2400 is not ruled out.
A candlestick chart view is graphical rectangles of white and black light, with sticks on top and bottom. When analyzing each candle in detail, you will see its characteristics of a relative period: the opening price, closing price, and maximum and minimum prices.
Horizontal levels are price coordinates, relative to which a stop or a price reversal may occur. These levels are called support and resistance in the market.
Circles and rectangles are highlighted examples where the price of the story unfolded. This color selection indicates horizontal lines that may put pressure on the quote in the future.
The up/down arrows are the reference points of the possible price direction in the future.
*Phân tích thị trường được đăng tải ở đây có nghĩa là để gia tăng nhận thức của bạn, nhưng không đưa ra các chỉ dẫn để thực hiện một giao dịch.
InstaSpot analytical reviews will make you fully aware of market trends! Being an InstaSpot client, you are provided with a large number of free services for efficient trading.


