


Đội ngũ của chúng tôi có hơn 7,000,000 thương nhân!
Hàng ngày chúng tôi làm việc cùng nhau để cải thiện việc giao dịch. Chúng tôi nhận được kết quả cao và luôn tiến lên phía trước.
Sự công nhận của hàng triệu thương nhân trên toàn thế giới là sự đánh giá tốt nhất cho công việc của chúng tôi! Bạn đã đưa ra quyết định của mình và chúng tôi sẽ làm mọi thứ cần thiết để đáp ứng mong đợi của bạn!
Chúng ta cùng với nhau sẽ là một nhóm tuyệt vời!
InstaSpot. Tự hào làm việc cho bạn!


Diễn viên, nhà vô địch mùa giải UFC 6 và là người hùng thật sự!
Người tự mình làm nên tất cả. Người đàn ông đáng kể học hỏi.
Bí mật đằng sau thành công của Taktarov là sự cố gắng liên tục hướng tới mục tiêu.
Hãy khai phá tất cả các mặt tài năng của bạn!
Khám phá, thử, thất bại - nhưng không bao giờ dừng lại!
InstaSpot. Câu chuyện thành công của bạn bắt đầu từ đây!
Details of the economic calendar from June 16
The results of the meeting of the Bank of England led to another increase in interest rates by 25 basis points, to 1.25% per annum. The event was expected, so the interest in it was low. The most intriguing point is that three members of the board voted for a 0.5% rate increase. In fact, it was this information that provoked the further strengthening of the pound sterling.
The main theses of the Bank of England:
The Bank of England expects UK GDP to decline by 0.3% in the 2nd quarter.
The Bank of England expects UK inflation to exceed 11% by the end of the year.
The Bank of England will continue to consider raising the key rate.
At the time of the announcement of the results of the meeting, the pound sterling fell against the US dollar by 0.9% in just 10 minutes. After that, the course was restored.
During the American trading session, data on jobless claims in the United States were published, where they recorded an increase in indicators with a forecast of their preservation. The divergence of expectations led to an increased sell-off of dollar positions in the market.
Statistics details:
The volume of continuing claims for benefits increased from 1.309 million to 1.312 million.
The volume of initial claims for benefits increased from 215,000 to 218,000.
Analysis of trading charts from June 16
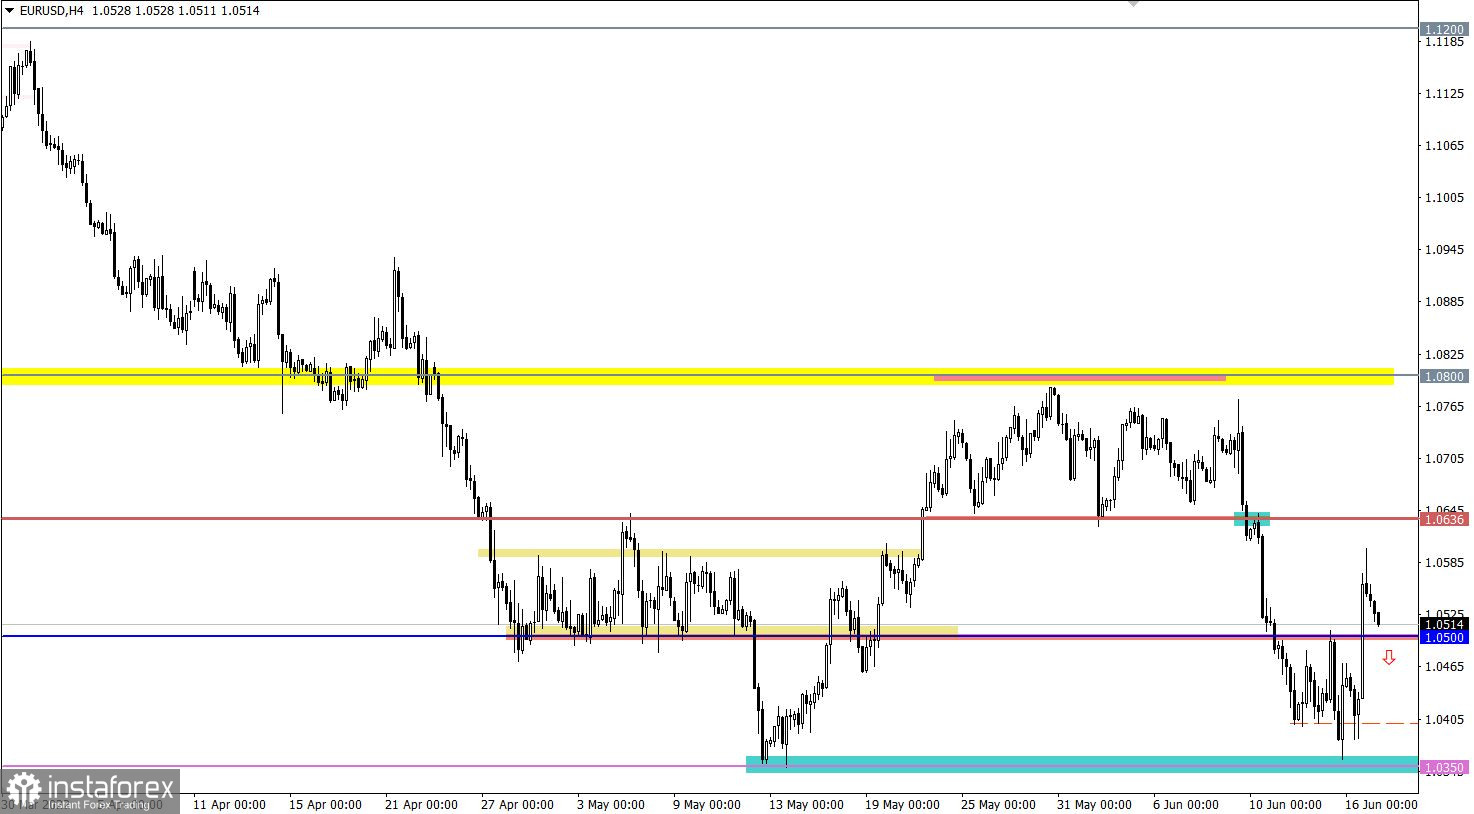
The EURUSD currency pair, after a short stagnation at the base of the downward trend, has moved into the correction stage. This movement led to the strengthening of the euro by about 200 points.
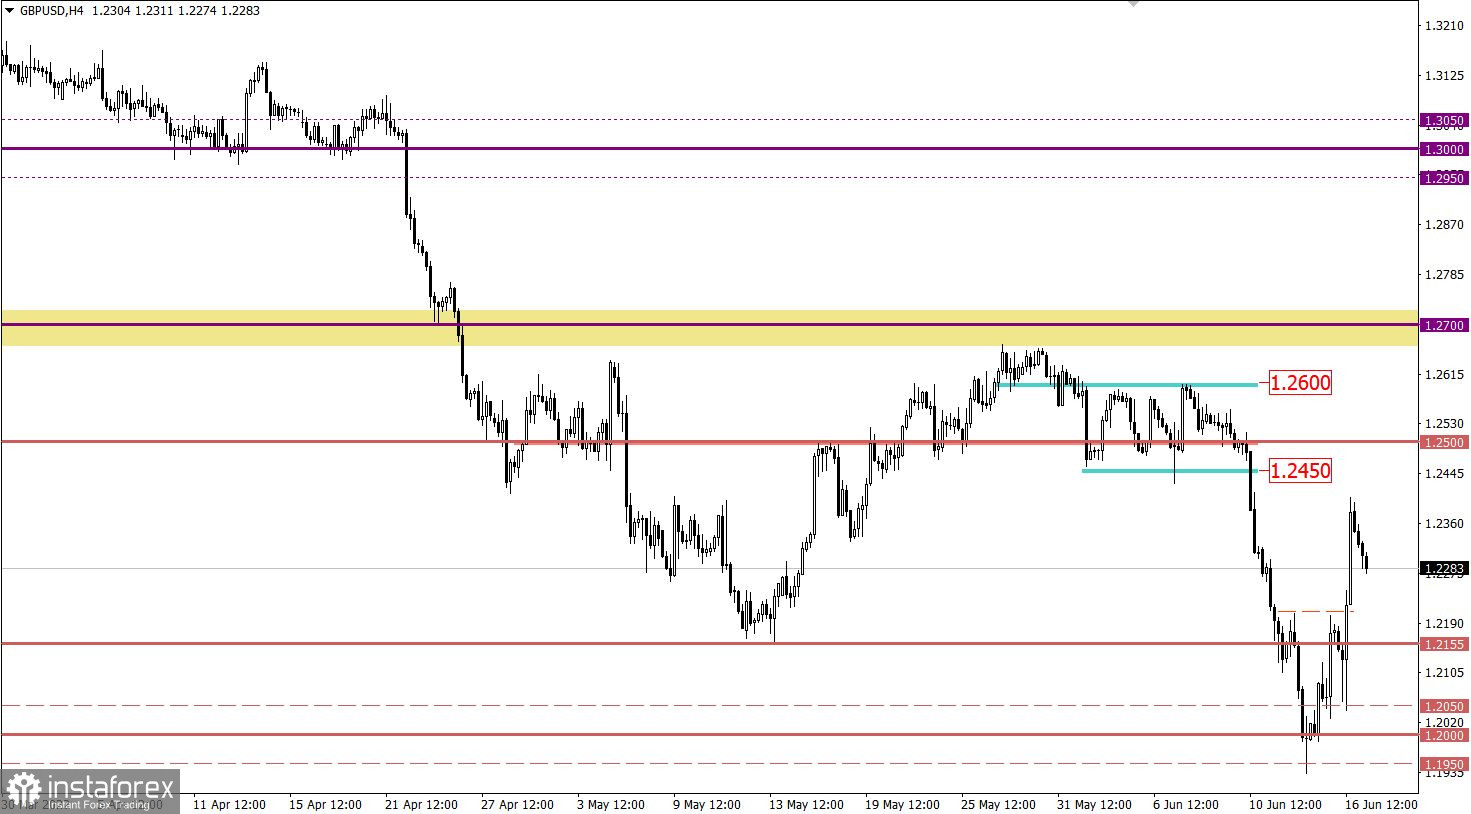
The British currency appreciated more than 400 points against the US dollar in two trading days. This is a strong price change in a short period of time, which indicates an overheating of long positions in the short term.

Economic calendar for June 17
Today, inflation data is expected for publication, and figures are expected to coincide with the preliminary estimate. Thus, everything is already taken into account in the quote.
During the American trading session, data on industrial production in the United States will be published, the growth rate of which may slow down from 6.4% to 4.9%. This may have a negative impact on dollar positions.
Time targeting
Inflation in the EU - 09:00 UTC
Industrial production in the USA - 13:15 UTC
Trading plan for EUR/USD on June 17
Based on the signal about overheating of long positions, the correction cycle slowed down the formation. The area of the level of 1.0636 serves as resistance, where the quote recently approached. At the moment, a phased restoration of dollar positions is being considered. The main signal about the growth of short positions in the euro will appear after a long hold of the price below the level of 1.0500.
Trading plan for GBP/USD on June 17
In view of the recent overbought signal of the pound sterling, a slowdown in the corrective move with a phased change in trading interest is allowed. This may lead to a reverse move with a partial recovery of dollar positions.
An alternative scenario will be considered by traders if the price holds above 1.2400 in a four-hour period. In this case, speculators can ignore the signal about the local overbought of the pound, directing the quote towards the mirror level of 1.2500.
What is reflected in the trading charts?
A candlestick chart view is graphical rectangles of white and black light, with sticks on top and bottom. When analyzing each candle in detail, you will see its characteristics of a relative period: the opening price, closing price, and maximum and minimum prices.
Horizontal levels are price coordinates, relative to which a stop or a price reversal may occur. These levels are called support and resistance in the market.
Circles and rectangles are highlighted examples where the price of the story unfolded. This color selection indicates horizontal lines that may put pressure on the quote in the future.
The up/down arrows are the reference points of the possible price direction in the future.
*Phân tích thị trường được đăng tải ở đây có nghĩa là để gia tăng nhận thức của bạn, nhưng không đưa ra các chỉ dẫn để thực hiện một giao dịch.
InstaSpot analytical reviews will make you fully aware of market trends! Being an InstaSpot client, you are provided with a large number of free services for efficient trading.


