


Đội ngũ của chúng tôi có hơn 7,000,000 thương nhân!
Hàng ngày chúng tôi làm việc cùng nhau để cải thiện việc giao dịch. Chúng tôi nhận được kết quả cao và luôn tiến lên phía trước.
Sự công nhận của hàng triệu thương nhân trên toàn thế giới là sự đánh giá tốt nhất cho công việc của chúng tôi! Bạn đã đưa ra quyết định của mình và chúng tôi sẽ làm mọi thứ cần thiết để đáp ứng mong đợi của bạn!
Chúng ta cùng với nhau sẽ là một nhóm tuyệt vời!
InstaSpot. Tự hào làm việc cho bạn!


Diễn viên, nhà vô địch mùa giải UFC 6 và là người hùng thật sự!
Người tự mình làm nên tất cả. Người đàn ông đáng kể học hỏi.
Bí mật đằng sau thành công của Taktarov là sự cố gắng liên tục hướng tới mục tiêu.
Hãy khai phá tất cả các mặt tài năng của bạn!
Khám phá, thử, thất bại - nhưng không bao giờ dừng lại!
InstaSpot. Câu chuyện thành công của bạn bắt đầu từ đây!
Details of the economic calendar from June 2
The ADP report on the employment rate in the United States recorded an increase of 128,000 in May. This is not bad data, but they predicted a more significant increase in employment, up to 300,000. Thus, the reason for the weakening of dollar positions took place in the market.
Almost simultaneously with the report, ADP published weekly data on jobless claims in the US, where they recorded a decrease in their volume. This is a positive factor for the US labor market, but it failed to fully compensate for the disappointment of traders from the employment report. Therefore, the US dollar continued to lose value.
Statistics details:
The volume of continuing claims for benefits decreased from 1.343 million to 1.309 million.
The volume of initial claims for benefits decreased from 211,000 to 200,000.
Analysis of trading charts from June 2
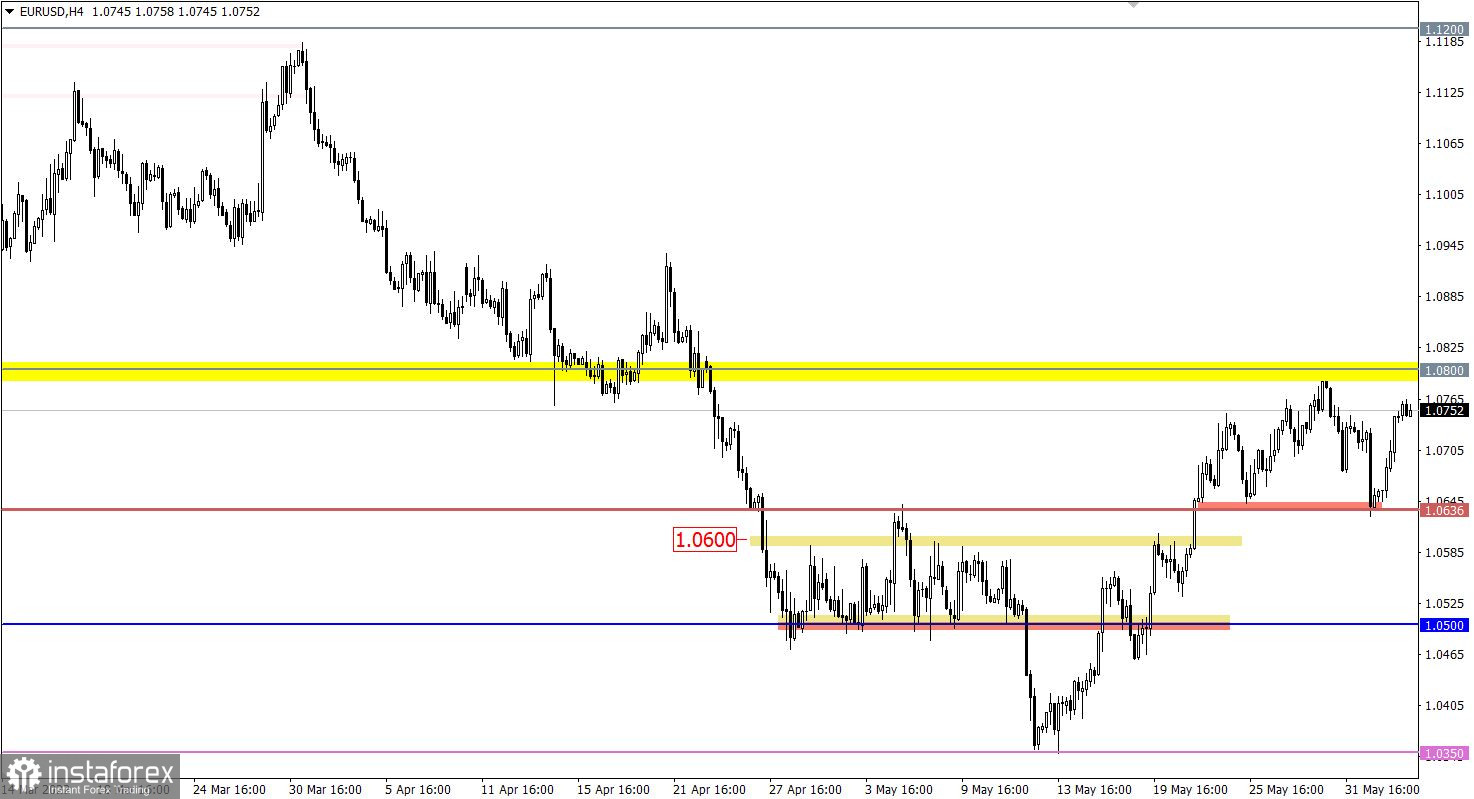
The EURUSD currency pair rebounded from the support level of 1.0636. This movement led to an almost complete recovery of the euro against the recent decline, as a result of which the corrective move from mid-May is still considered relevant in the market.
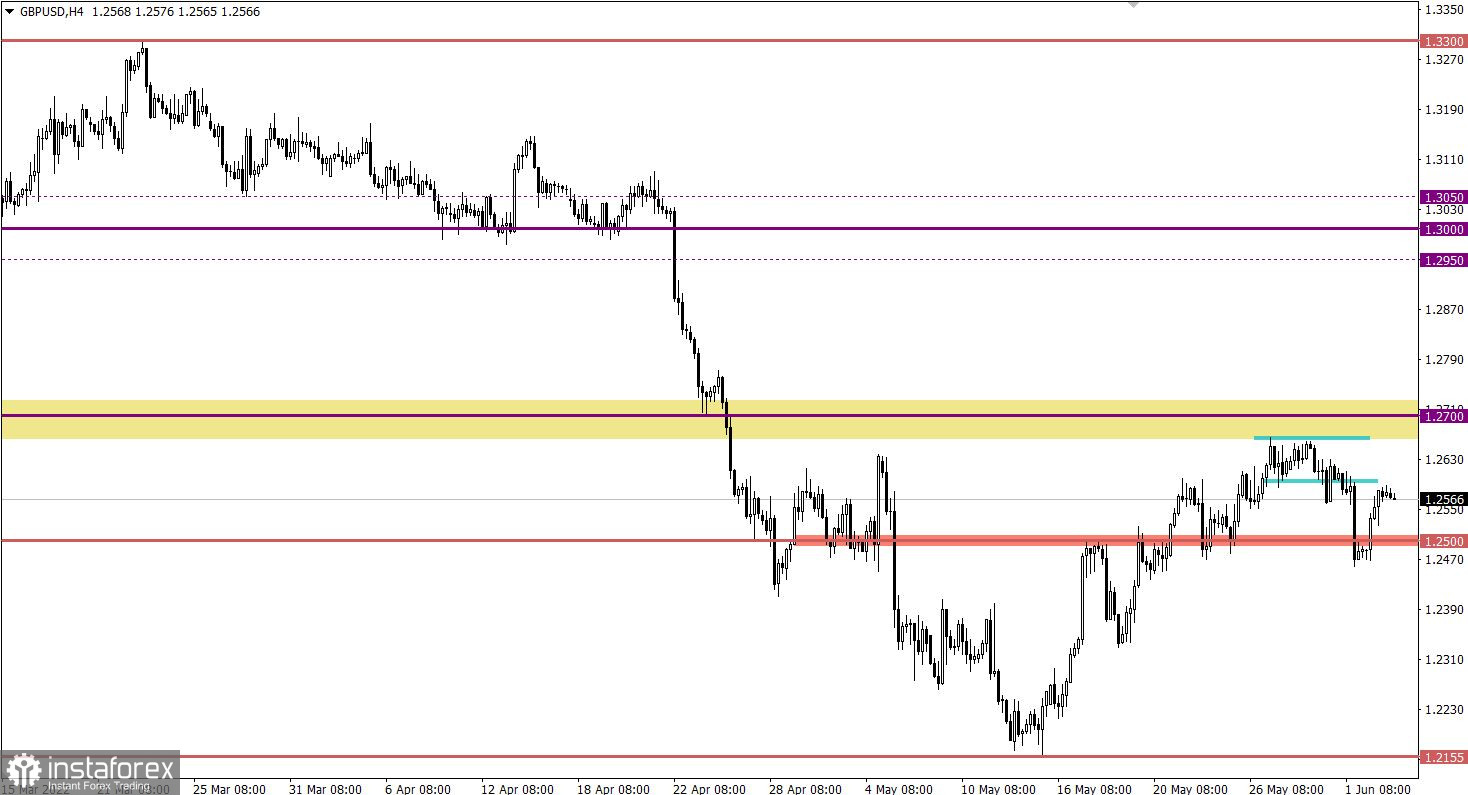
After a short stop, the GBPUSD pair rebounded from the support level of 1.2500, indicating its false breakdown. The rebound was accompanied by a high interest in long positions, which made it possible for buyers to return to the area of 1.2570. In fact, we once again saw a signal about the preservation of the correction in the market.

Economic calendar for June 3
Retail sales data in the euro area is expected for publication today. Forecasts assumed growth in figures, which may provide local support for the euro before the American trading session.
The main macroeconomic event of the outgoing week is considered to be the report of the United States Department of Labor, which predicts by no means bad indicators. The unemployment rate could drop from 3.6% to 3.5%, and 325,000 new jobs could be created outside of agriculture. We have a strong US labor market, which could support the US dollar.
Time targeting
EU retail sales - 09:00 UTC
US Department of Labor Report - 12:30 UTC
Trading plan for EUR/USD on June 3
Based on the recent price change, we can assume that the market has a local signal that the euro is overbought in the short term. This can lead to a slowdown in the upward cycle followed by a rebound. The price area of 1.0770/1.0800 is considered as resistance on the way of buyers.
The scenario of the prolongation of the corrective move will be considered by traders if the price stays above 1.0850 for at least a four-hour period.
Trading plan for GBP/USD on June 3
In this situation, traders consider two possible scenarios at once:
The first one comes from the preservation of rising interest in the market, where holding the price above 1.2600 can return the quote to the resistance area of 1.2670/1.2720.
The second scenario considers the possibility of completing a corrective move, where holding the price below 1.2530 will lead to another attempt to break through the support level of 1.2500. The largest increase in the volume of short positions will occur after the price holds below 1.2450, which will confirm the signal about the completion of the correction.
What is reflected in the trading charts?
A candlestick chart view is graphical rectangles of white and black light, with sticks on top and bottom. When analyzing each candle in detail, you will see its characteristics of a relative period: the opening price, closing price, and maximum and minimum prices.
Horizontal levels are price coordinates, relative to which a stop or a price reversal may occur. These levels are called support and resistance in the market.
Circles and rectangles are highlighted examples where the price of the story unfolded. This color selection indicates horizontal lines that may put pressure on the quote in the future.
The up/down arrows are the reference points of the possible price direction in the future.
*Phân tích thị trường được đăng tải ở đây có nghĩa là để gia tăng nhận thức của bạn, nhưng không đưa ra các chỉ dẫn để thực hiện một giao dịch.
InstaSpot analytical reviews will make you fully aware of market trends! Being an InstaSpot client, you are provided with a large number of free services for efficient trading.


