


Huyền thoại trong nhóm InstaSpot!
Huyền thoại! Bạn nghĩ rằng đó là lời nói khoa trương? Nhưng chúng ta nên gọi một người đàn ông như thế nào, người đã trở thành người châu Á đầu tiên giành chức vô địch cờ vua thế giới lứa tuổi thiếu niên năm 18 tuổi và người trở thành Đại kiện tướng Ấn Độ đầu tiên năm 19 tuổi? Đó là khởi đầu cho con đường khó khăn đến danh hiệu Vô địch Thế giới của Viswanathan Anand, người đàn ông đã trở thành một phần của lịch sử cờ vua mãi mãi. Giờ đây, một huyền thoại nữa trong nhóm InstaSpot!


Borussia là một trong những câu lạc bộ bóng đá danh giá nhất nước Đức, đã nhiều lần chứng minh cho người hâm mộ thấy: tinh thần thi đấu và sự lãnh đạo chắc chắn sẽ dẫn đến thành công. Giao dịch theo cách mà các chuyên gia thể thao chơi trò chơi: tự tin và chủ động. Giữ một "đường chuyền" từ Borussia FC và dẫn đầu với InstaSpot!
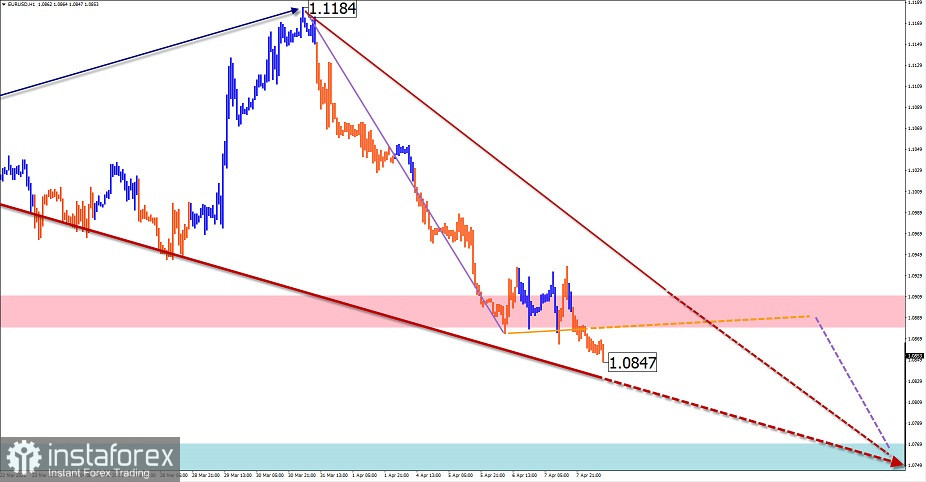
EUR/USD
Analysis:
On the daily chart of the euro, the downward wave has not completed. It sets the direction for all short-term price fluctuations in the pair. The last section of the wave dates back from March 31. The upper boundary of the strong potential reversal zone is near the calculated support.
Outlook:
In the next 24 hours, a flat movement lasting for the last two days is likely to end and the resumption of the price decline is possible. It is highly probable that a downward movement will complete in the support area.
Potential reversal zones
Resistance:
- 1.0880/1.0910
Support:
- 1.0770/1.0740
Recommendations:
There are no conditions for buying the euro in the market today. It is recommended to monitor all emerging signals to sell the instrument in the area of calculated resistance
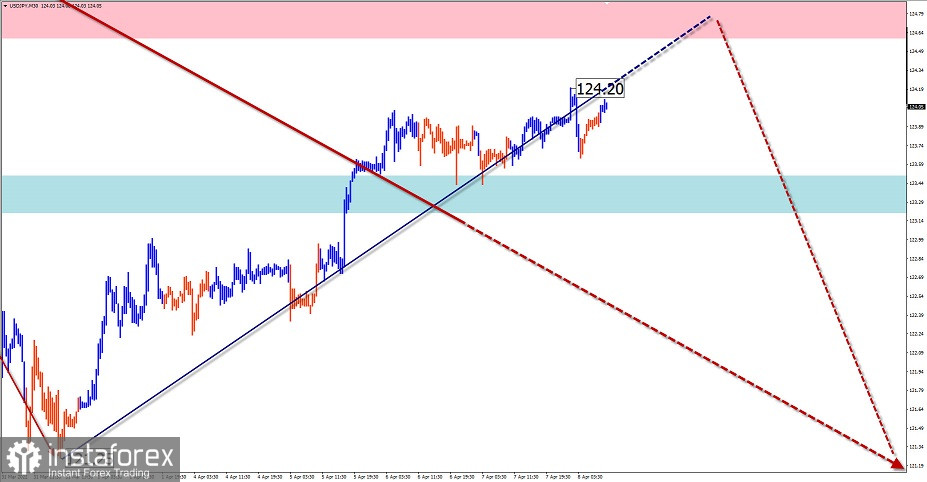
USD/JPY
Analysis:
On the chart of the Japanese yen, an upward wave lasting from the start of 2021 ended on March 28. The ensuing price decline formed the first part of the wave structure (A), following the formation of its incomplete middle part (B).
Outlook:
The price growth is likely to end in the coming days. A formation of the reversal and the resumption of the price decline is possible in the area of the calculated resistance. In case of the change in trend, a short-term piercing of the upper boundary of the resistance area is probable.
Potential reversal zones.
Resistance:
- 124.60/124.90
Support:
- 123.50/123.20
Recommendations:
Small lot and short-term purchases of the Japanese yen are possible in the morning. It is advisable not to enter the pair's market until there are sell signals around the resistance area.
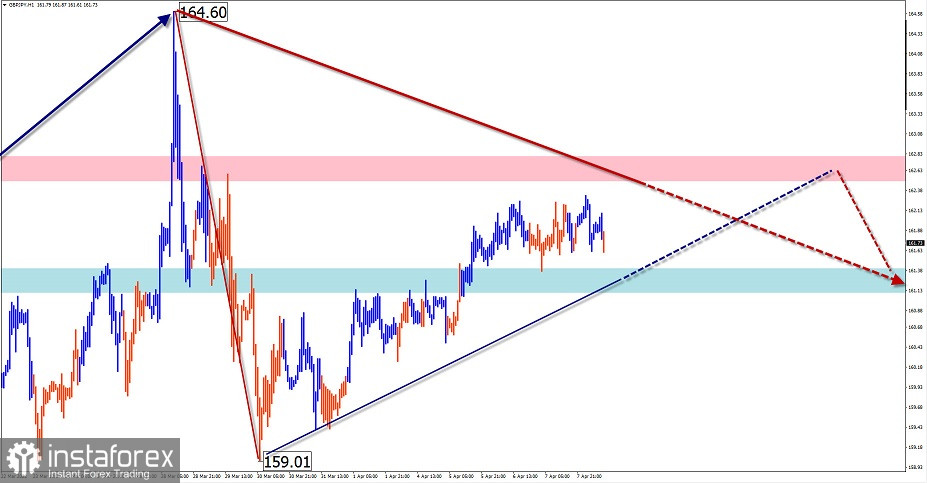
GBP/JPY
Analysis:
On the chart of the GBP/JPY pair, the direction of the short-term trend is set by an upward wave dating back from March 7. The pair has been forming a corrective plane since March 28. The middle part (B) is developing within its structure.
Outlook:
A further sideways price movement is possible in the near future. A downward vector is most likely. A renewal of a bullish trend with the price growth to the calculated resistance is expected at the end of day or tomorrow. Afterwards, a return to the downward direction is likely.
Potential reversal zones.
Resistance:
- 162.50/162.80
Support:
- 161.40/161.10
Recommendations:
Today, trading is possible only within individual sessions with small lots. It is recommended to close positions at the first reversal signals. It is advisable to buy the pair from the support area in the morning.
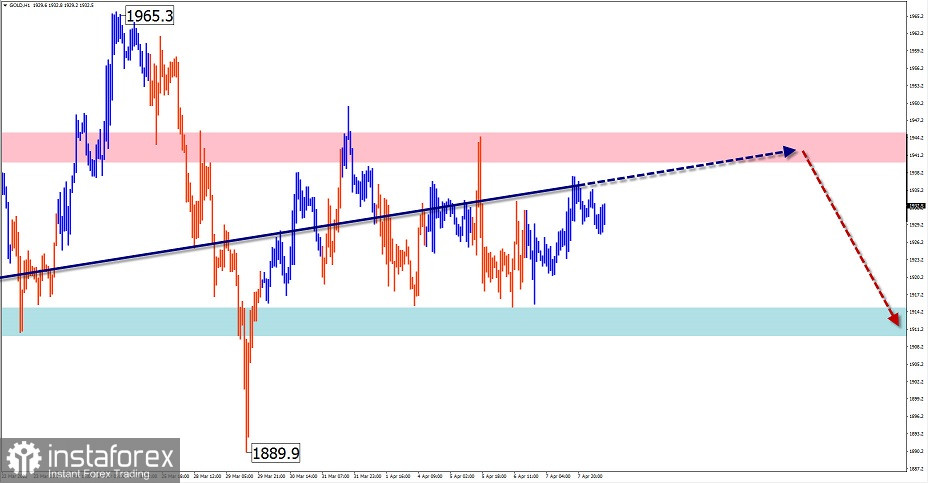
GOLD
Analysis:
In the short term, the direction of the gold trend is set by the algorithm of the downward wave dating back from March 8. A horizontal plane resembling a pennant pattern has been forming for three weeks. After it ends, the decline will continue.
Outlook:
A further sideways price movement is expected in the next trading sessions. A downward vector is more likely in the morning. The price growth to the resistance zone is possible at the end of the day or tomorrow.
Potential reversal zones.
Resistance:
- 1940.0/1945.0
Support:
- 1915.0/1910.0
Recommendations:
Trading in the current situation is extremely risky and may lead to losses. Short-term transactions within the price corridor are possible. It is advisable not to enter the market until there are sell signals in the resistance area.
Explanation: In the simplified wave analysis (UVA), waves consist of 3 parts (A-B-C). The last incomplete wave is analyzed. The solid background of the arrows shows the formed structure and the dotted background shows the expected movements.
Note: The wave algorithm does not take into account the duration of the instrument's movements in time!
*Phân tích thị trường được đăng tải ở đây có nghĩa là để gia tăng nhận thức của bạn, nhưng không đưa ra các chỉ dẫn để thực hiện một giao dịch.
InstaSpot analytical reviews will make you fully aware of market trends! Being an InstaSpot client, you are provided with a large number of free services for efficient trading.


