


Huyền thoại trong nhóm InstaSpot!
Huyền thoại! Bạn nghĩ rằng đó là lời nói khoa trương? Nhưng chúng ta nên gọi một người đàn ông như thế nào, người đã trở thành người châu Á đầu tiên giành chức vô địch cờ vua thế giới lứa tuổi thiếu niên năm 18 tuổi và người trở thành Đại kiện tướng Ấn Độ đầu tiên năm 19 tuổi? Đó là khởi đầu cho con đường khó khăn đến danh hiệu Vô địch Thế giới của Viswanathan Anand, người đàn ông đã trở thành một phần của lịch sử cờ vua mãi mãi. Giờ đây, một huyền thoại nữa trong nhóm InstaSpot!


Borussia là một trong những câu lạc bộ bóng đá danh giá nhất nước Đức, đã nhiều lần chứng minh cho người hâm mộ thấy: tinh thần thi đấu và sự lãnh đạo chắc chắn sẽ dẫn đến thành công. Giao dịch theo cách mà các chuyên gia thể thao chơi trò chơi: tự tin và chủ động. Giữ một "đường chuyền" từ Borussia FC và dẫn đầu với InstaSpot!
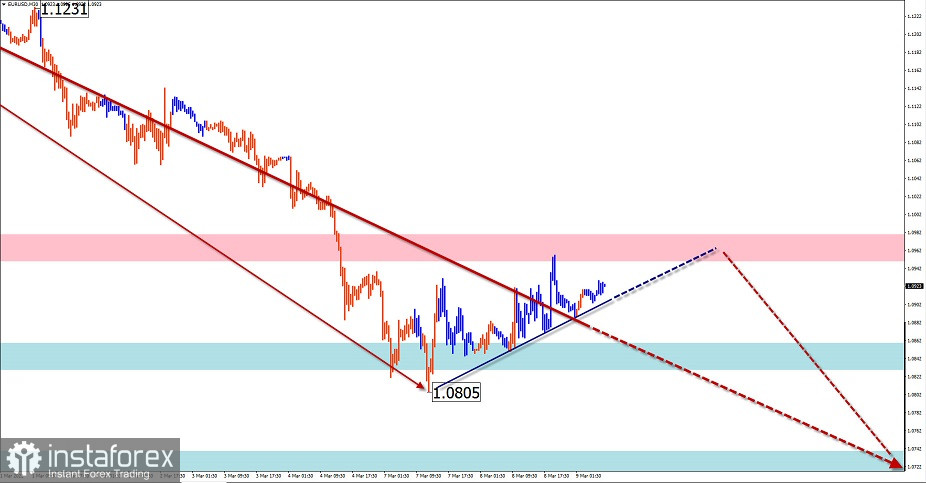
EUR/USD
Analysis:
On the chart of the European currency, the downtrend set last January has been resuming. The unfinished section started on February 4. The counter movements are corrective in nature.
Outlook:
Today, a flat movement is expected in the morning with the price growing to the calculated resistance zone. A reversal and resumption of the downtrend is likely at the end of the day or tomorrow. Further support is set by the level of the preliminary target zone.
Potential reversal zones.
Resistance:
- 1.0950/1.0980
Support:
- 1.0860/1.0830
- 1.0740/1.0710
Recommendations:
There are no conditions for buying the euro today. It is recommended to monitor the emerging reversal signals for selling the pair in the area of the calculated resistance.
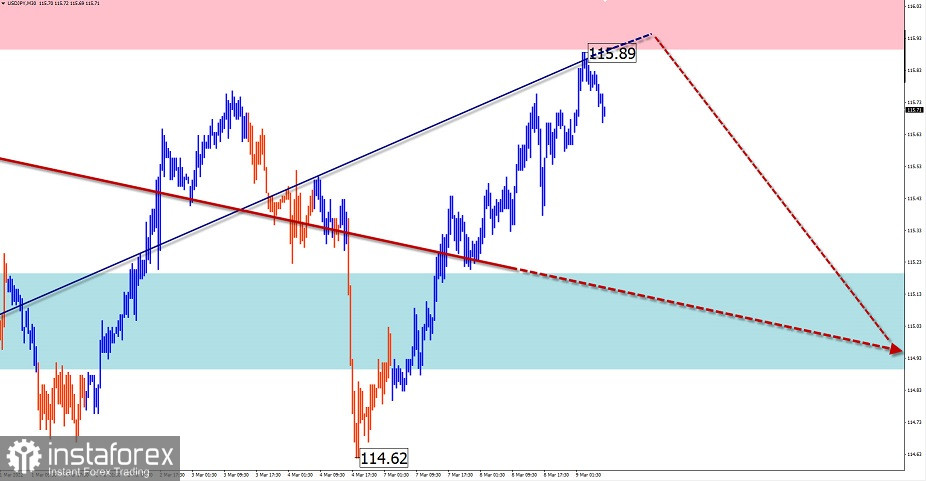
USD/JPY
Analysis:
Due to the price growth, the Japanese yen has reached the lower boundary of the strong resistance zone by early 2022. The price has been forming a corrective structure since then. This structure has an ascending pennant pattern. Currently, the price is at the upper border of the price corridor.
Outlook:
A reversal and price decline to the area of the calculated support is expected in the next day after probable pressure on the resistance area. When the exchange rate changes, a rise in volatility is possible.
Zones of potential reversal
Resistance:
- 115.90/116.20
Support:
- 115.20/114.90
Recommendations:
Today, trading the Japanese yen is more risky and may lead to losses. It is recommended not to enter the pair's market until the upcoming decline is completed.
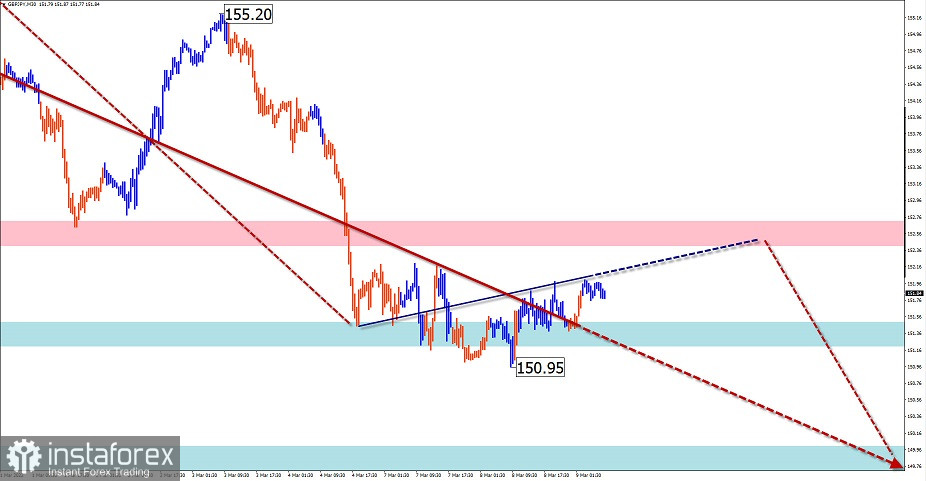
GBP/JPY
Analysis:
The wave pattern of the British pound/Japanese yen cross chart has changed due to the recent price decline. The current fluctuations are within the algorithm of the descending wave of October 20. The structure of this wave resembles a horizontal plane.
Outlook:
Today, a flat movement with an upward vector is more likely in the morning. A reversal and return to the bear market is expected in the area of the calculated resistance. If the nearest support is broken, the decline will continue to the next zone.
Potential reversal zones.
Resistance:
- 152.40/152.70
Support:
- 151.20/150.90
- 150.00/149.70
Recommendations:
There are no conditions to buy the GBP/JPY pair today. It is recommended not to enter the pair's market until the formation of confirmed signals for selling the pair.
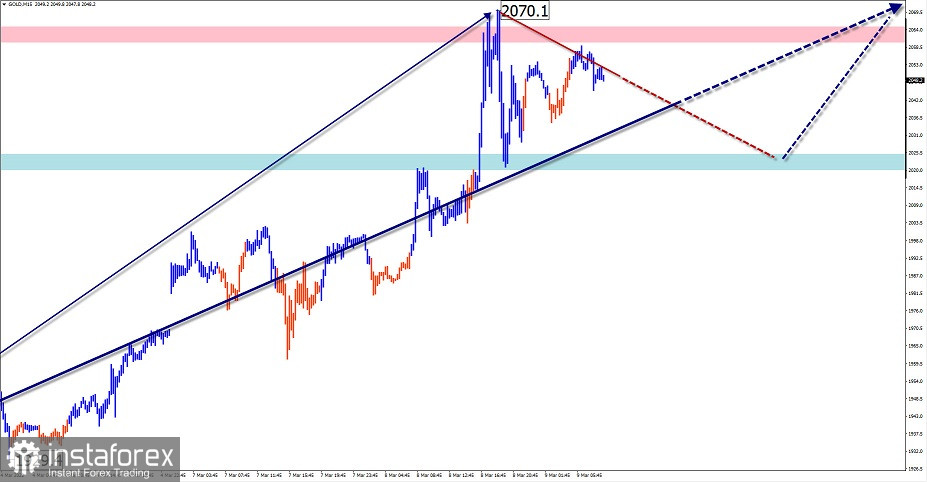
GOLD
Analysis:
On the gold chart, an ascending wave has been forming since June last year. The upward spurt of the last decade completed the missing final part (C) of the wave. Quotes have reached the boundaries of a strong potential reversal zone of the senior timeframe. No reversal signals are observed at the moment of analysis.
Outlook:
In the next day, the price is expected to move mainly sideways. A reversal and the decline in the rate to the support zone is expected after the probable pressure on the resistance zone.
Potential reversal zones
Resistance:
- 2060.0/2065.0
Support:
- 2020.0/2015.0
Recommendations:
Currently, trading gold is extremely risky. It will be possible to sell gold in small lots after the formation of confirmed signals of reversal. It is advisable not to enter the pair's market until the upcoming decline ends.
Explanation: In the simplified wave analysis (UVA), waves consist of 3 parts (A-B-C). The last incomplete wave is analyzed. The solid background of the arrows shows the formed structure and the dotted background shows the expected movements.
Note: The wave algorithm does not take into account the duration of the instrument's movements in time!
*Phân tích thị trường được đăng tải ở đây có nghĩa là để gia tăng nhận thức của bạn, nhưng không đưa ra các chỉ dẫn để thực hiện một giao dịch.
InstaSpot analytical reviews will make you fully aware of market trends! Being an InstaSpot client, you are provided with a large number of free services for efficient trading.


