


Đội ngũ của chúng tôi có hơn 7,000,000 thương nhân!
Hàng ngày chúng tôi làm việc cùng nhau để cải thiện việc giao dịch. Chúng tôi nhận được kết quả cao và luôn tiến lên phía trước.
Sự công nhận của hàng triệu thương nhân trên toàn thế giới là sự đánh giá tốt nhất cho công việc của chúng tôi! Bạn đã đưa ra quyết định của mình và chúng tôi sẽ làm mọi thứ cần thiết để đáp ứng mong đợi của bạn!
Chúng ta cùng với nhau sẽ là một nhóm tuyệt vời!
InstaSpot. Tự hào làm việc cho bạn!


Diễn viên, nhà vô địch mùa giải UFC 6 và là người hùng thật sự!
Người tự mình làm nên tất cả. Người đàn ông đáng kể học hỏi.
Bí mật đằng sau thành công của Taktarov là sự cố gắng liên tục hướng tới mục tiêu.
Hãy khai phá tất cả các mặt tài năng của bạn!
Khám phá, thử, thất bại - nhưng không bao giờ dừng lại!
InstaSpot. Câu chuyện thành công của bạn bắt đầu từ đây!
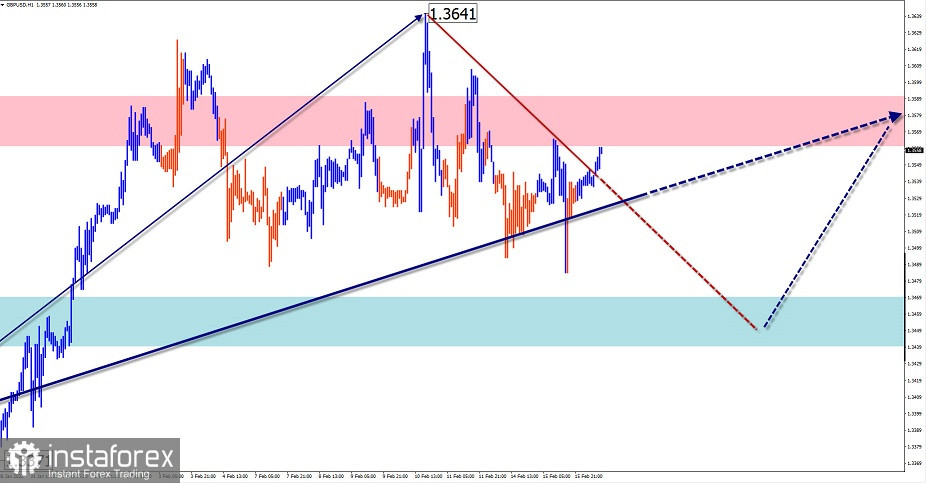
GBP/USD
Analysis:
According to the price chart, the wave structure of GBP/USD is moving up in the short term. The last incomplete section of the wave started to emerge on January 27. Over the past 2 weeks, the quote has moved sideways, forming a flat correction. At the moment of writing, the sideways move was not finished.
Outlook:
Today, the general sideways movement is expected to continue, predominantly with a downward vector. The approximate target zone is determined by the support levels.
Potential reversal areas
Resistance:
- 1.3560/1.3590
Support:
- 1.3470/1.3440
Recommendations:
Today, it will be possible to sell the pound sterling with a fractional lot in the short term. Speaking of the trading strategy, it would be wise to enter the market only after the confirmation of the buy signal in the support zone.
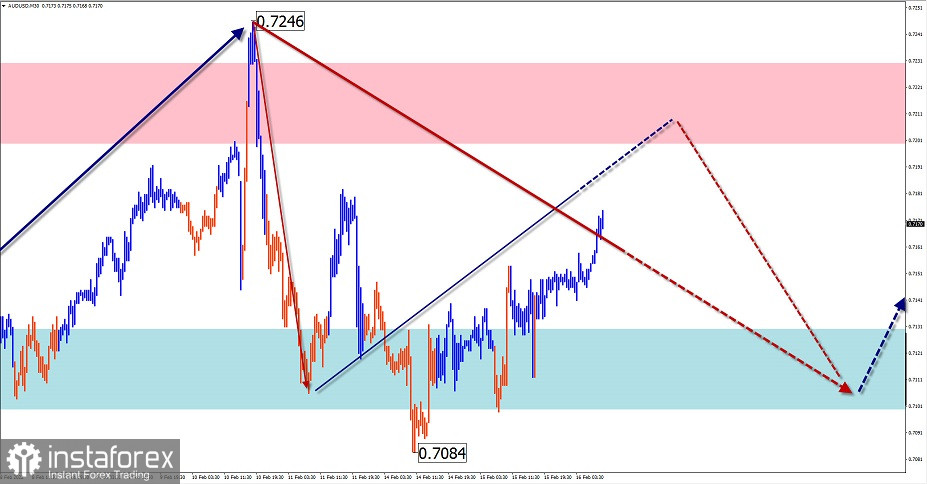
AUD/USD
Analysis:
The AUD/USD pair has mostly been bullish over the past year. The formation of the new upward wave started on January 28. A corrective zigzag is now forming in the opposite direction from the reversal zone of the higher time frame.
Outlook:
Today, a flat movement is expected on the price chart. The current uptrend may end soon. In case a reversal occurs by the end of the day, the quote will return to the support zone.
Potential reversal areas
Resistance:
- 0.7200/0.7230
Support:
- 0.7130/0.7100
Recommendations:
Today, short-term trades on AUD/USD with a fractional lot could bring a profit. Meanwhile, short positions could be opened from the resistance zone.
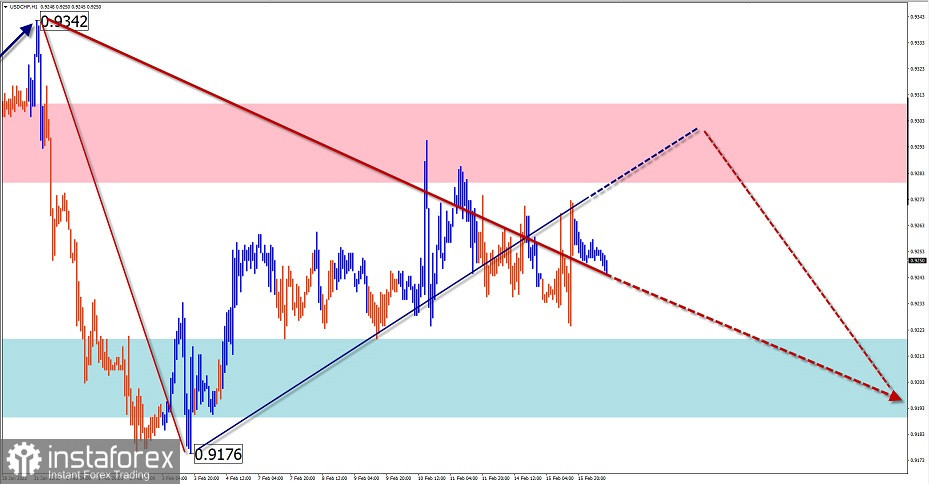
USD/CHF
Analysis:
The analysis of the price chart of USD/CHF over the past month shows that the descending wave that started to emerge on June 18 is still forming. The latest bearish section as of January 27 may reverse. If a reversal is confirmed, the final C sub-wave will begin to form. Over the past 2 weeks, an intermediate pullback has been developing on the chart.
Outlook:
The general sideways movement is likely to continue today. In the first half of the day, an upward vector is more likely. At the end of the day, the price is expected to go down to the support zone.
Potential reversal areas
Resistance:
- 0.9280/0.9310
Support:
- 0.9220/0.9190
Recommendations:
Trades could be unprofitable before the flat movement ends. Therefore, it would be wise to wait for the end of the flat and then enter the market when there are sell signals in the area of the resistance zone.
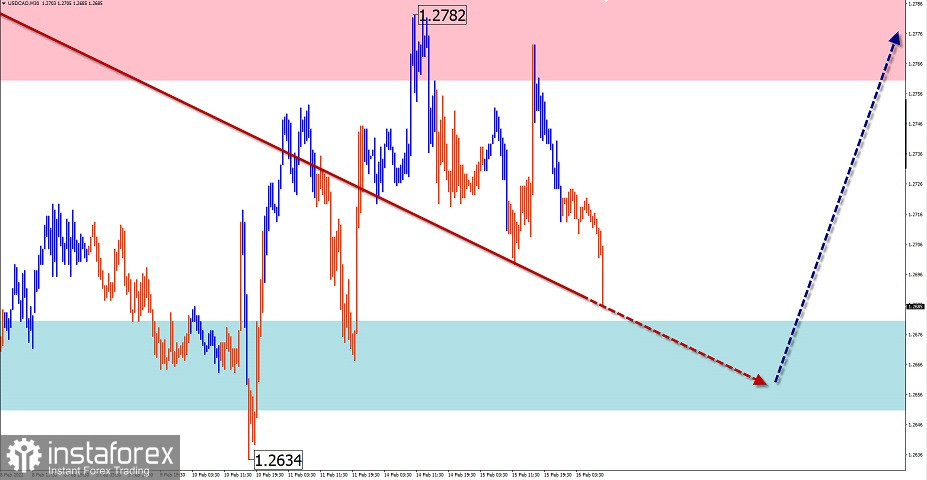
USD/CAD
Analysis:
The USD/CAD has traded in an uptrend since last May. The incomplete section of the wave is ascending and has been forming since January 13. A flat correction started to develop in February. It has not been completed yet.
Outlook:
Today, the price is expected to trade in the range between the resistance and support zones. In the European session, the bearish trend is expected to turn into a sideways movement. The uptrend may resume by the end of the day or tomorrow.
Potential reversal areas
Resistance:
- 1.2760/1.2790
Support:
- 1.2680/1.2650
Recommendations:
Long positions could be opened as soon as signals of your trading strategy are confirmed in the area of the support zone.
Note: In simple wave analysis, we review a three-wave pattern labeled A-B-C and analyze the last incomplete wave. Straight arrows show the completed wave structure, while dashed lines show the expected movements.
Warning: The wave pattern does not take into account the duration of the instrument's movements in time!
*Phân tích thị trường được đăng tải ở đây có nghĩa là để gia tăng nhận thức của bạn, nhưng không đưa ra các chỉ dẫn để thực hiện một giao dịch.
InstaSpot analytical reviews will make you fully aware of market trends! Being an InstaSpot client, you are provided with a large number of free services for efficient trading.


