


Đội ngũ của chúng tôi có hơn 7,000,000 thương nhân!
Hàng ngày chúng tôi làm việc cùng nhau để cải thiện việc giao dịch. Chúng tôi nhận được kết quả cao và luôn tiến lên phía trước.
Sự công nhận của hàng triệu thương nhân trên toàn thế giới là sự đánh giá tốt nhất cho công việc của chúng tôi! Bạn đã đưa ra quyết định của mình và chúng tôi sẽ làm mọi thứ cần thiết để đáp ứng mong đợi của bạn!
Chúng ta cùng với nhau sẽ là một nhóm tuyệt vời!
InstaSpot. Tự hào làm việc cho bạn!


Diễn viên, nhà vô địch mùa giải UFC 6 và là người hùng thật sự!
Người tự mình làm nên tất cả. Người đàn ông đáng kể học hỏi.
Bí mật đằng sau thành công của Taktarov là sự cố gắng liên tục hướng tới mục tiêu.
Hãy khai phá tất cả các mặt tài năng của bạn!
Khám phá, thử, thất bại - nhưng không bao giờ dừng lại!
InstaSpot. Câu chuyện thành công của bạn bắt đầu từ đây!
EUR/USD, USD/JPY, GBP/JPY, GOLD simplified wave analysis and outlook for February 11, 2022
In the next 24 hours, trading the euro might be risky. It is possible to open short-term sell trades from the current resistance zone with a fractional lot. However, it is better to wait with opening new positions until the support zone is reached.
EUR/USD
Analysis:
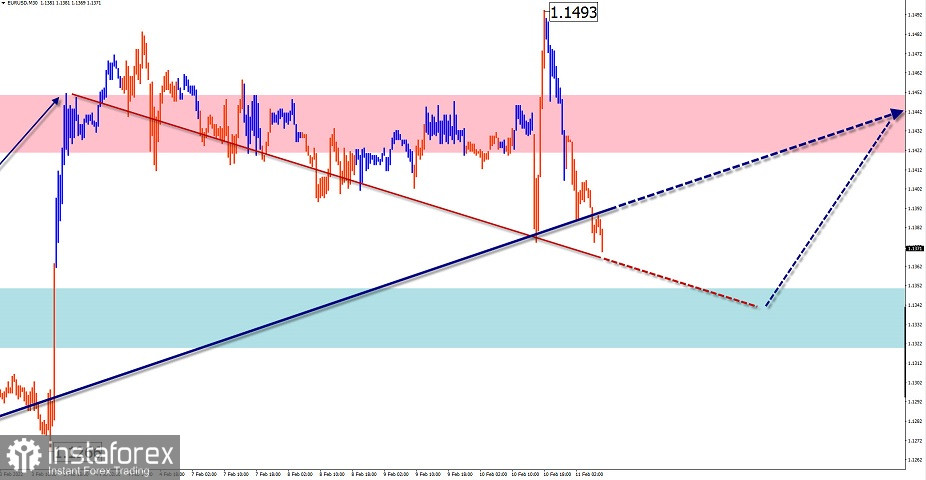
The upward movement from January 28 indicates the last unfinished wave structure of the euro chart. Throughout the past week, the pair was moving in the opposite direction along strong resistance, which resembled an extended flat structure. If the price stays within the correction, the current wave will eventually move to a higher time frame. Currently, there are no signals on the chart indicating a trend reversal.
Outlook:
In the coming days, the pair is expected to complete the descending section of the trend. Then it may form a reversal and resume an uptrend. The quote is more likely to reverse at the current support zone.
Potential reversal zones:
Resistance:
- 1.1420/1.1450
Support:
- 1.1350/1.1320
Recommendations:
In the next 24 hours, trading the euro might be risky. It is possible to open short-term sell trades from the current resistance zone with a fractional lot. However, it is better to wait with opening new positions until the support zone is reached.
USD/JPY
Analysis:
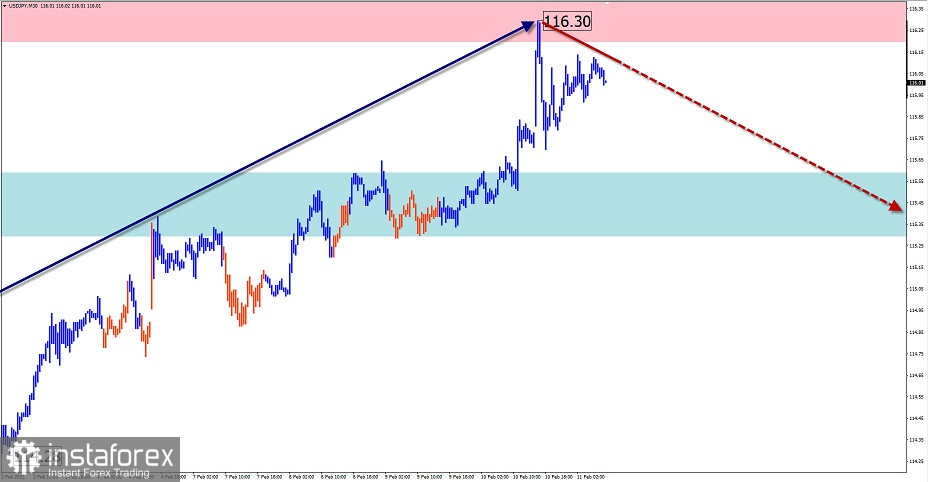
For defining the prospects of the yen/dollar pair on the intraday chart, let us analyze the structure of the ascending wave formed on November 30.There, we can observe a clear A-B-C zigzag pattern. The quotes have reached the upper boundary of a strong resistance zone on a larger time frame. The downward movement that started yesterday has a reversal potential.
Outlook:
The pair is likely to move sideways in the coming sessions. After the bullish pressure on the resistance zone, the price may reverse and decline towards the support area.
Potential reversal zones:
Resistance:
- 116.20/116.50
Support:
- 115.60/115.30
Recommendations:
It is not recommended to trade when the pair is moving sideways. It is better to wait for the price to complete the upcoming pullback and look for buy signals when the pullback ends.
GBP/JPY
Analysis:
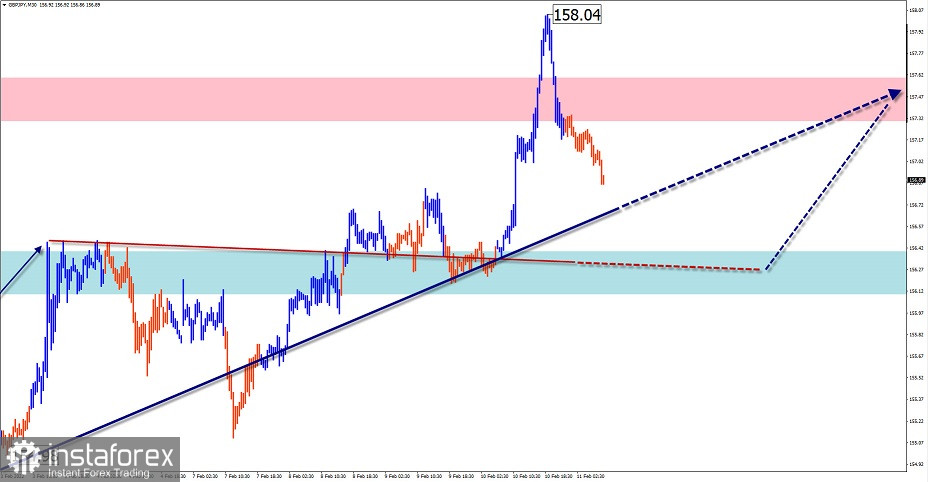
The GBP/JPY pair has been forming an ascending wave since the end of last year. After breaking through the intermediate resistance zone, the quote has pulled back, forming a correction against the last section (C) of the incomplete wave.
Outlook:
In the near future, the cross pair is expected to decline further. In the European session, it may also develop a short-term rise towards the resistance zone. The estimated support level may serve as the nearest downward target.
Potential reversal zones:
Resistance:
- 157.30/157.60
Support:
- 156.40/156.10
Recommendations:
Today, it is advised to trade the pound/yen pair within short trading sessions with a reduced lot. It is safer to open sell positions from the resistance zone.
GOLD
Analysis:
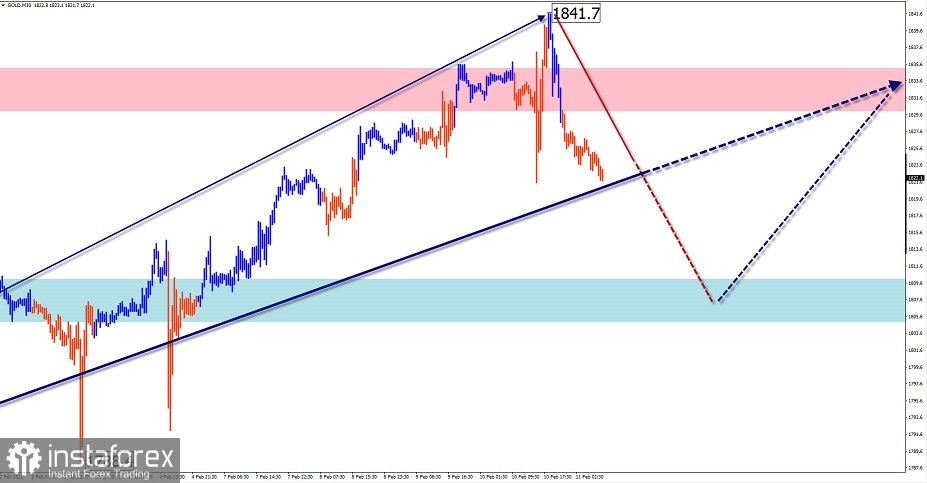
Since March 2021, the ascending wave has been dominating on the gold's chart. The unfinished section of the wave dates back to January 28. In recent days, gold has been moving lower after touching resistance, thus forming a correction (B).
Outlook:
Gold is likely to extend its downward movement in the next few days. The estimated support zone may act as the nearest downward target. In the coming sessions, the price may go through a short-term pullback towards the resistance zone.
Potential reversal zones:
Resistance:
- 1830.0/1835.0
Support:
- 1810.0/1805.0
Recommendations:
On Friday, it is possible to go short on the instrument near the current resistance level. Trades should be closed at the first signals of a trend reversal. It is better to trade with a reduced lot.
Explanation: In simplified wave analysis (SWA), waves consist of 3 parts (A-B-C). We analyze the last unfinished wave. The solid arrow background shows the structure that has been formed. The dashed lines show the expected movements.
Note: The wave algorithm does not take into account the duration of the instrument's movements over time!
*Phân tích thị trường được đăng tải ở đây có nghĩa là để gia tăng nhận thức của bạn, nhưng không đưa ra các chỉ dẫn để thực hiện một giao dịch.
InstaSpot analytical reviews will make you fully aware of market trends! Being an InstaSpot client, you are provided with a large number of free services for efficient trading.


