


Huyền thoại trong nhóm InstaSpot!
Huyền thoại! Bạn nghĩ rằng đó là lời nói khoa trương? Nhưng chúng ta nên gọi một người đàn ông như thế nào, người đã trở thành người châu Á đầu tiên giành chức vô địch cờ vua thế giới lứa tuổi thiếu niên năm 18 tuổi và người trở thành Đại kiện tướng Ấn Độ đầu tiên năm 19 tuổi? Đó là khởi đầu cho con đường khó khăn đến danh hiệu Vô địch Thế giới của Viswanathan Anand, người đàn ông đã trở thành một phần của lịch sử cờ vua mãi mãi. Giờ đây, một huyền thoại nữa trong nhóm InstaSpot!


Borussia là một trong những câu lạc bộ bóng đá danh giá nhất nước Đức, đã nhiều lần chứng minh cho người hâm mộ thấy: tinh thần thi đấu và sự lãnh đạo chắc chắn sẽ dẫn đến thành công. Giao dịch theo cách mà các chuyên gia thể thao chơi trò chơi: tự tin và chủ động. Giữ một "đường chuyền" từ Borussia FC và dẫn đầu với InstaSpot!
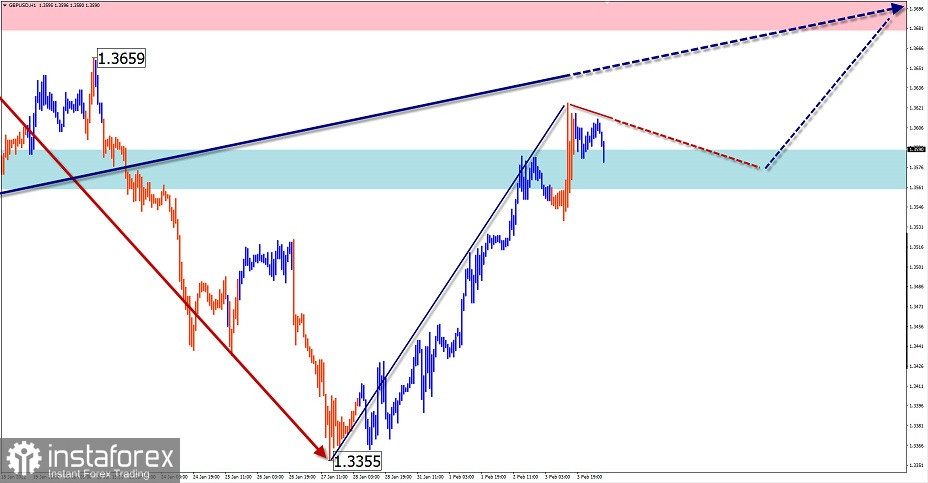
GBP/USD
Wave analysis:
In the short term, the uncompleted wave has been building since November last year. On January 27, the final part of the wave (C) began to develop. The wave has an impulse form with small rollbacks.
Outlook:
The pound sterling is expected to maintain its upward movement today. In the first half of the day, it may be trading flat the support zone. The resistance zone is located on the lower border of a potentially large-scale reversal zone.
Potential reversal areas
Resistance
- 1.3680/1.3710
Support
- 1.3590/1.3560
Tips:
Today, it is recommended to open long positions on the pound/dollar pair at the support level. Please, keep in mind that a deep correction may begin in the resistance zone.
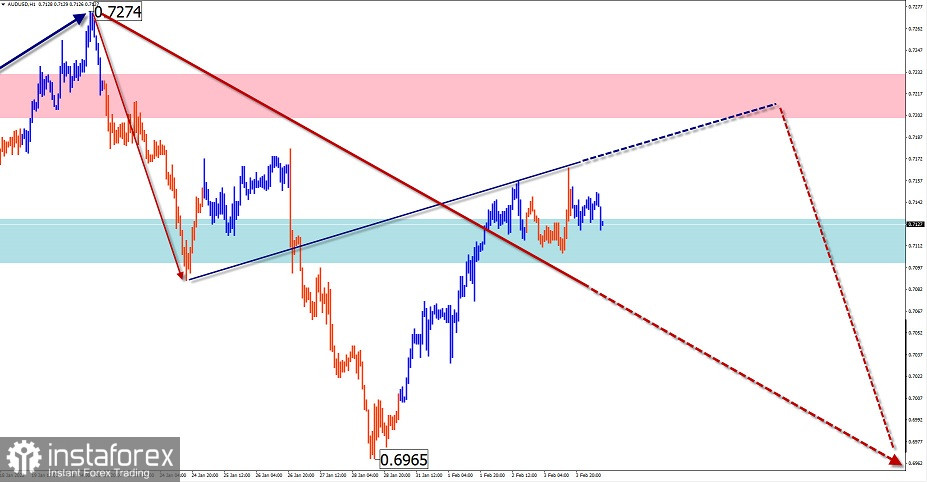
AUD/USD
Wave analysis:
Since February last year, the Australian dollar has been weakening against the US currency. There is an unfinished section of the downward wave that originated on January 13. The ascending part of the chart that began on January 28 does not exceed the correction wave. The resistance level is located at the lower boundary of the target zone.
Outlook:
At the next trading session, the pair is likely to move sideways near the boundaries of the support zone. At the end of the day or tomorrow, it is likely to resume an upward movement.
Potential reversal areas
Resistance:
- 0.7200/0.7230
Support:
- 0.7130/0.7100
Tips:
There are no entry points to open short positions on the Aussie. It is recommended to look for buy signals in the support area.
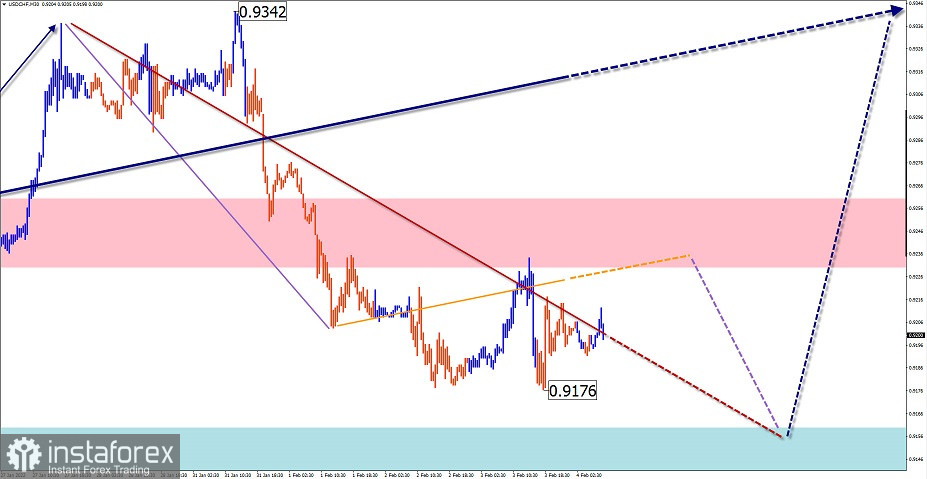
USD/CHF
Wave analysis:
Since June last year, the Swiss franc has been forming a downward wave, moving mainly in the narrow range. Last month, price fluctuations changed the layout of the emerging wave structure. In fact, the formation of the middle part of the wave (B) is still underway. In the last decade, the price has been declining.
Outlook:
Today, the pair is expected to trade in the sideways channel between the nearest support and resistance areas. In the first half of the day, an upward movement may occur. At the end of the day, the pair is likely to resume a downward movement.
Potential reversal areas
Resistance:
- 0.9230/0.9260
Support:
- 0.9160/0.9130
Tips:
In the near future, it is better to stick to fractional trading when opening positions on the Swiss franc.
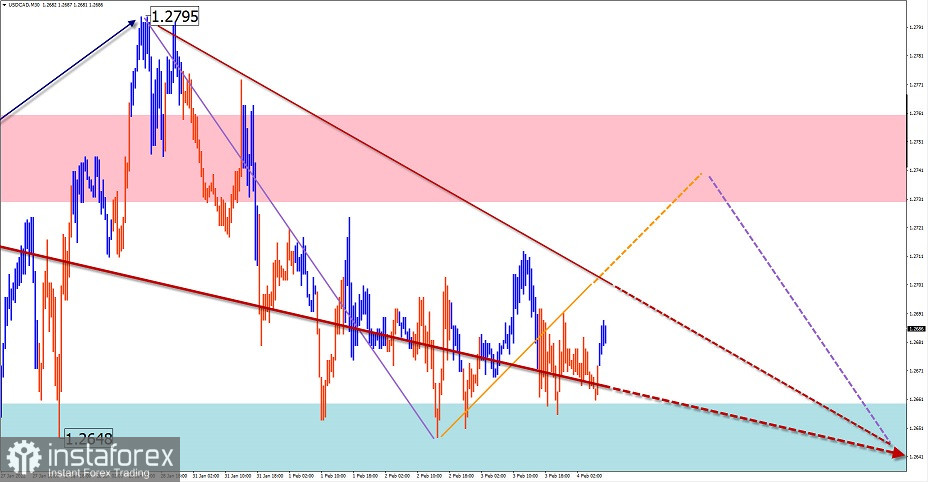
USD/CAD
Wave analysis:
Wave analysis of the Canadian dollar shows that the upward structure that originated on May 18 is incomplete. Since December 20, a bearish zigzag (B) has been formed. At the time of making the analysis, the quotes have almost reached the lower limit of the strong resistance on a large chart. The downward section that developed on January 28 may trigger a reversal potential. It could be the final part of the correction.
Outlook:
Over the next few days, the price is expected to move sideways. In the first half of the day, the pair is likely to rise.
Potential reversal areas
Resistance:
- 1.2730/1.2760
Support:
- 1.2660/1.2630
Tips:
The pair s trading flat. So, trading activity may be low. for this reason, the Canadian dollar may decline. It is recommended to refrain from opening new positions, looking for clear sell signals in the resistance area.
Explanation: In simplified wave analysis, waves consist of 3 parts (A-B-C). The last incomplete wave is analyzed. The arrows show the formed structure, the dotted one shows the expected movements.
Important: The wave layout does not take into account the duration of the movements of the instrument in time!
*Phân tích thị trường được đăng tải ở đây có nghĩa là để gia tăng nhận thức của bạn, nhưng không đưa ra các chỉ dẫn để thực hiện một giao dịch.
InstaSpot analytical reviews will make you fully aware of market trends! Being an InstaSpot client, you are provided with a large number of free services for efficient trading.


