


Đội ngũ của chúng tôi có hơn 7,000,000 thương nhân!
Hàng ngày chúng tôi làm việc cùng nhau để cải thiện việc giao dịch. Chúng tôi nhận được kết quả cao và luôn tiến lên phía trước.
Sự công nhận của hàng triệu thương nhân trên toàn thế giới là sự đánh giá tốt nhất cho công việc của chúng tôi! Bạn đã đưa ra quyết định của mình và chúng tôi sẽ làm mọi thứ cần thiết để đáp ứng mong đợi của bạn!
Chúng ta cùng với nhau sẽ là một nhóm tuyệt vời!
InstaSpot. Tự hào làm việc cho bạn!


Diễn viên, nhà vô địch mùa giải UFC 6 và là người hùng thật sự!
Người tự mình làm nên tất cả. Người đàn ông đáng kể học hỏi.
Bí mật đằng sau thành công của Taktarov là sự cố gắng liên tục hướng tới mục tiêu.
Hãy khai phá tất cả các mặt tài năng của bạn!
Khám phá, thử, thất bại - nhưng không bao giờ dừng lại!
InstaSpot. Câu chuyện thành công của bạn bắt đầu từ đây!
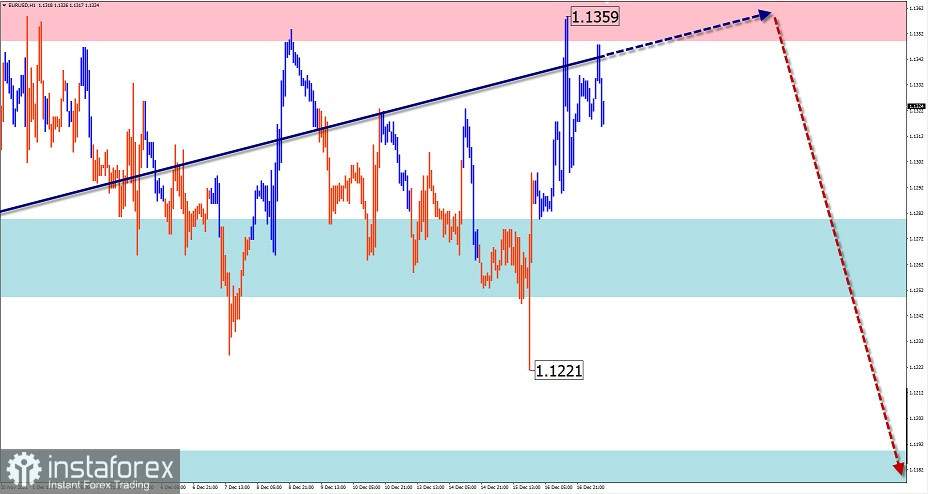
EUR/USD
Analysis:
The descending wave from January 6 continues to set the main direction of the European currency on the price chart of the major pair. Since the end of last month, along the upper boundary of the potential reversal zone, quotations have been forming an intermediate price pullback in the form of a horizontal plane. The structure of the wave is close to completion. There are no immediate reversal signals on the chart.
Outlook:
In the coming trading sessions, after the probable pressure on the resistance zone, a change of course and the beginning of the decline is expected. In case the lower boundary of the nearest support is breached, the move downwards will continue to the next zone.
Potential reversal zones
Resistance:
- 1.1350/1.1380
Support:
- 1.1280/1.1250
- 1.1190/1.1160
Recommendations:
There are no conditions for purchases in the euro market today. In the area of the calculated resistance, it is recommended to monitor emerging signals to sell the instrument.
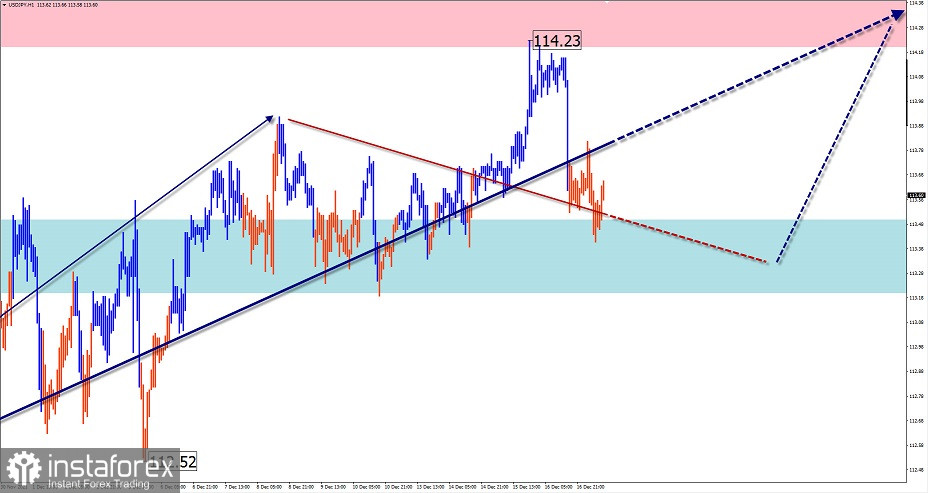
USD/JPY
Analysis:
On the chart of the main Japanese Yen pair, the main trend direction since the beginning of the year is set by an ascending wave. The incomplete ascending wave from November 30 is of particular interest on the small scale of the chart. Its wave level is not yet sufficient to start the next part of the main trend. All last week in the horizontal corridor the price formed correction (B) for the first part of the movement (A).
Outlook:
In the coming trading sessions, we expect the end of the downward movement, the formation of a reversal, and the beginning of the growth of the instrument.
Potential reversal zones
Resistance:
- 114.20/114.50
Support:
- 113.50/113.20
Recommendations:
Short-term purchases from the support zone are possible in the Japanese Yen market today. It is safer to reduce the lot size.
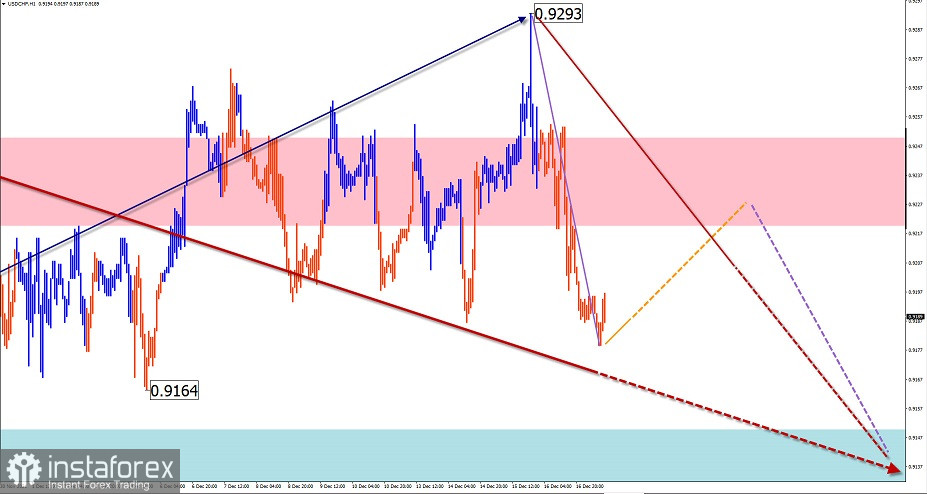
USD/CHF
Analysis:
On the Swiss franc chart, the current downtrend since mid-June has reached its final phase. The incomplete upward section of the chart from November 30 has no reversal potential, correcting the last part of the wave. In terms of its structure, the correction is closest to a stretched plane.
Outlook:
During the coming sessions, the price is expected to move towards the nearest support levels. A short-term pullback to the upper boundary of the price corridor is possible in the first half of the day.
Potential reversal zones
Resistance:
- 0.9220/0.9250
Support:
- 0.9150/0.9120
Recommendations:
Trading in the franc market today is only possible with small lots, within individual trading sessions. Selling the pair is more promising.
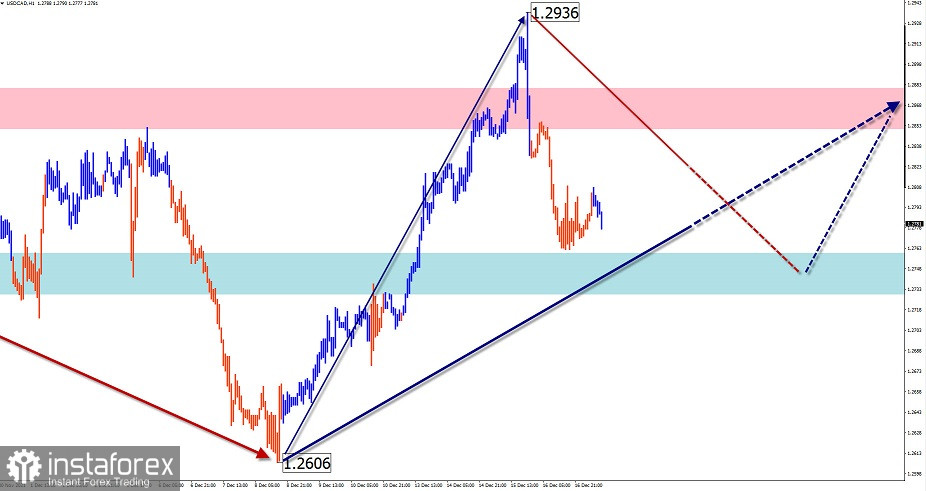
USD/CAD
Analysis:
Price swings in recent weeks have changed the wave pattern of the Canadian dollar chart. The incomplete uptrend from December 8 today fits into the algorithm of the ongoing bullish correction from May 18. After the current pullback down the rate will continue to rise.
Outlook:
In the first half of the day, we can expect a flat movement along the support zone. At the end of the day, volatility is expected to increase and a new round of price growth is expected, up to the calculated resistance zone.
Potential reversal zones
Resistance:
- 1.2850/1.2880
Support:
- 1.2760/1.2730
Recommendations:
Trading in the Canadian dollar market today is possible after the appearance of clear buy signals around the support area. There are no conditions for sale today.
Explanation: In simplified wave analysis (SVA), waves consist of 3 parts (A-B-C). The last unfinished wave is analysed. The solid arrow background shows the structure formed. The dotted arrow shows the expected movements.
Attention: The wave algorithm does not take into account the duration of the instrument movements over time!
*Phân tích thị trường được đăng tải ở đây có nghĩa là để gia tăng nhận thức của bạn, nhưng không đưa ra các chỉ dẫn để thực hiện một giao dịch.
InstaSpot analytical reviews will make you fully aware of market trends! Being an InstaSpot client, you are provided with a large number of free services for efficient trading.


