


Đội ngũ của chúng tôi có hơn 7,000,000 thương nhân!
Hàng ngày chúng tôi làm việc cùng nhau để cải thiện việc giao dịch. Chúng tôi nhận được kết quả cao và luôn tiến lên phía trước.
Sự công nhận của hàng triệu thương nhân trên toàn thế giới là sự đánh giá tốt nhất cho công việc của chúng tôi! Bạn đã đưa ra quyết định của mình và chúng tôi sẽ làm mọi thứ cần thiết để đáp ứng mong đợi của bạn!
Chúng ta cùng với nhau sẽ là một nhóm tuyệt vời!
InstaSpot. Tự hào làm việc cho bạn!


Diễn viên, nhà vô địch mùa giải UFC 6 và là người hùng thật sự!
Người tự mình làm nên tất cả. Người đàn ông đáng kể học hỏi.
Bí mật đằng sau thành công của Taktarov là sự cố gắng liên tục hướng tới mục tiêu.
Hãy khai phá tất cả các mặt tài năng của bạn!
Khám phá, thử, thất bại - nhưng không bao giờ dừng lại!
InstaSpot. Câu chuyện thành công của bạn bắt đầu từ đây!
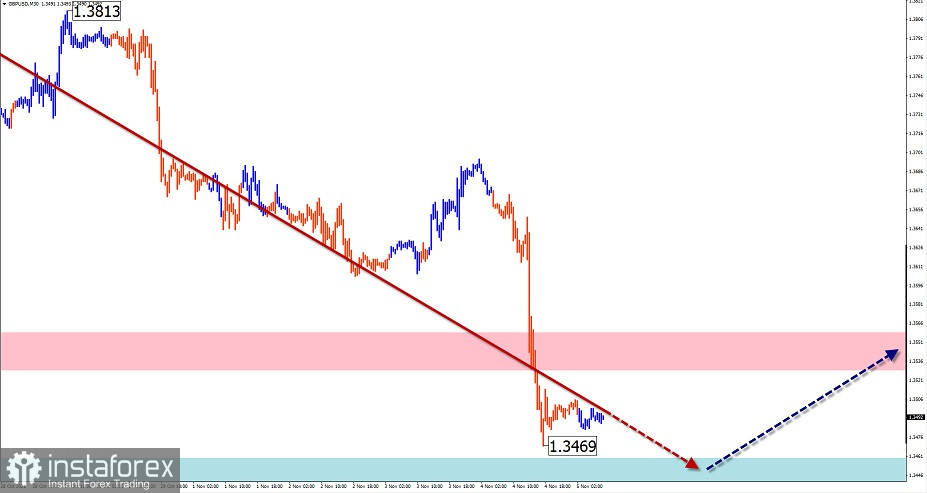
GBP/USD
Analysis:
The latest incomplete section of the English pound's market-dominating uptrend has been running since September 29. The pair's price has been declining over the past three weeks, forming a correction (B). The price is approaching the upper boundary of the potential reversal zone of the large TF.
Forecast:
In the first half of the day, we can expect a flat trend for the pair. An upward vector is possible, with a gradual rise to resistance zone levels. By the end of the day, there is an increased probability of rising volatility, reversal, and a renewed decline.
Potential reversal zones
Resistance:
- 1.3530/1.3560
Support:
- 1.3460/1.3430
Recommendations:
Pound trading is rather risky today. Short-term selling from the resistance zone is possible. It is better to not trade until there are strong buying signals in the area of the support zone.
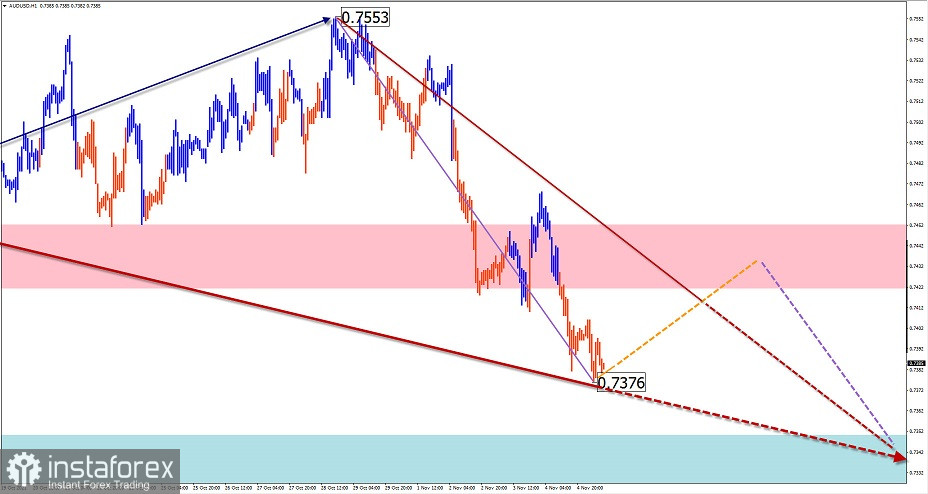
AUD/USD
Analysis:
Since last March, the pair's market has been dominated by an up-trend. The uptrend from August 20 has reversal potential. From the intermediate resistance, the price has been forming a correction during the last two weeks. Its structure at the time of the analysis does not look complete.
Forecast:
In the upcoming European session, the pair's price is expected to move sideways. There could be a short-term price increase, not further than the resistance zone. A return to a bearish rate can be expected by the end of the day.
Potential reversal zones
Resistance:
- 0.7420/0.7450
Support:
- 0.7350/0.7320
Recommendations:
There are no buying conditions in the Australian dollar market today. Short-term selling from the resistance zone with a smaller lot is possible.
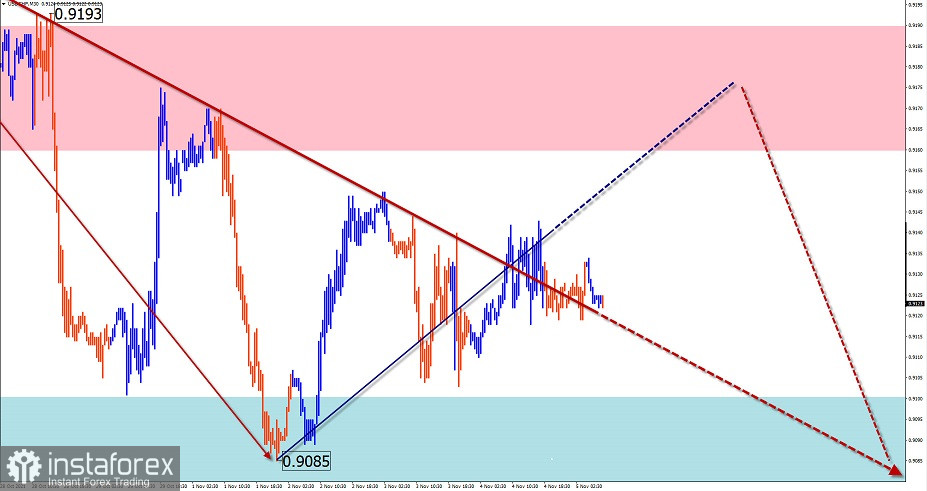
USD/CHF
Analysis:
On the chart of the Swiss franc against the American currency incomplete wave structure at the time of analysis is the descending wave from June 18. Within its final part (C), the price has been forming a flat pullback since the end of last month.
Forecast:
The general sideways movement is expected to continue today. The upper boundary of the price swing is in the area of settlement resistance. At the end of the day, there is a high probability of a return to a bearish course.
Potential reversal zones
Resistance:
- 0.9160/0.9190
Support:
- 0.9100/0.9070
Recommendations:
Trading in the Swiss franc market today could lead to losses. It is recommended not to enter into the market until the current pullback is over, looking for selling signals around the resistance zone.
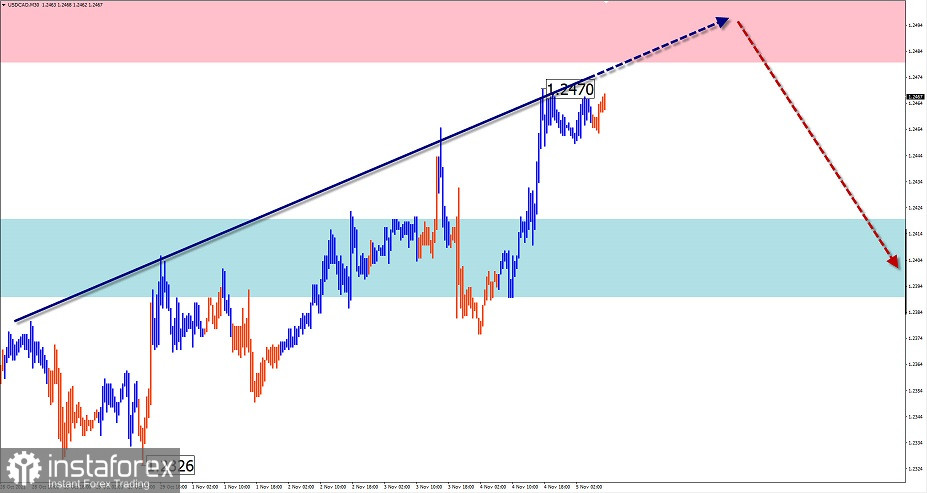
USD/CAD
Analysis:
The downward wave of the main Canadian dollar pair chart, which started in August, continues its formation. The bullish section from October 21 forms an intermediate pullback in the final part (C).
Forecast:
In the next 24 hours, the entire upward movement is expected to end, reverse and start a counter decline. The boundaries of the expected daily range are indicated by the settlement zones.
Potential reversal zones
Resistance:
- 1.2480/1.2510
Support:
- 1.2420/1.2390
Recommendations:
There are no conditions for buying in the Canadian dollar market today. It is recommended to follow all emerging signals to sell the instrument in the area of settlement resistance.
Explanations: In simplified wave analysis, waves consist of 3 parts (A-B-C). The last unfinished wave is analyzed. The solid arrow background shows the formed structure, the dotted background shows the expected movements.
Attention: The wave algorithm does not take into account the duration of instrument movements!
*Phân tích thị trường được đăng tải ở đây có nghĩa là để gia tăng nhận thức của bạn, nhưng không đưa ra các chỉ dẫn để thực hiện một giao dịch.
InstaSpot analytical reviews will make you fully aware of market trends! Being an InstaSpot client, you are provided with a large number of free services for efficient trading.


