


Đội ngũ của chúng tôi có hơn 7,000,000 thương nhân!
Hàng ngày chúng tôi làm việc cùng nhau để cải thiện việc giao dịch. Chúng tôi nhận được kết quả cao và luôn tiến lên phía trước.
Sự công nhận của hàng triệu thương nhân trên toàn thế giới là sự đánh giá tốt nhất cho công việc của chúng tôi! Bạn đã đưa ra quyết định của mình và chúng tôi sẽ làm mọi thứ cần thiết để đáp ứng mong đợi của bạn!
Chúng ta cùng với nhau sẽ là một nhóm tuyệt vời!
InstaSpot. Tự hào làm việc cho bạn!


Diễn viên, nhà vô địch mùa giải UFC 6 và là người hùng thật sự!
Người tự mình làm nên tất cả. Người đàn ông đáng kể học hỏi.
Bí mật đằng sau thành công của Taktarov là sự cố gắng liên tục hướng tới mục tiêu.
Hãy khai phá tất cả các mặt tài năng của bạn!
Khám phá, thử, thất bại - nhưng không bao giờ dừng lại!
InstaSpot. Câu chuyện thành công của bạn bắt đầu từ đây!
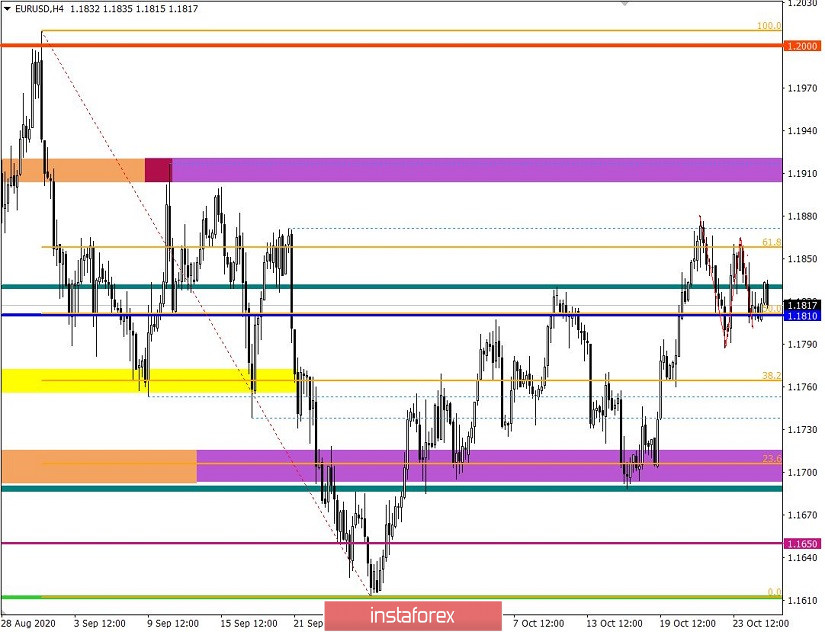
The EUR/USD pair managed to return again to the area of the price level of 1.1810 yesterday, where there was a stop and a price rebound in the opposite direction.
In fact, this is the second swing in the level of 1.1810 for two consecutive days, where the local high of 1.1880 was not updated. Therefore, we should not jump to conclusions that the four-week ascending path (1.1612 - - - > 1.1880) has come to an end. There are signals that the upward movement is completed, but at the same time, we may encounter an accumulation stage. This will be discussed later in more detail.
If we go back to see the four-hour time frame last October 21 until to the current day, there is a zigzag-like pattern movement, with a compression amplitude, which is highly likely to lead to an acceleration in the market. Now, we should pay special attention to two values: the peak (1.1880) and the base (1.1787) of the zigzag-shaped pattern. If one of the above values breaks down, it will cause orders to cascade, and this will lead to an acceleration towards a breakdown.
Here, we understand that there is a slowing down stage of the four-week upward course, which is confirmed by the zigzag-shaped pattern, but this same pattern can be a stage of accumulation in a big game of speculators, where it is worth working exclusively on the breakdown of a certain control level.
Looking at yesterday's fifteen-minute TF, you can see that trading began with a downward gap, which set the pace in the morning. After reaching the level of 1.1810, the volume of sell positions immediately declined, which led to a slowdown and followed by a price rebound.
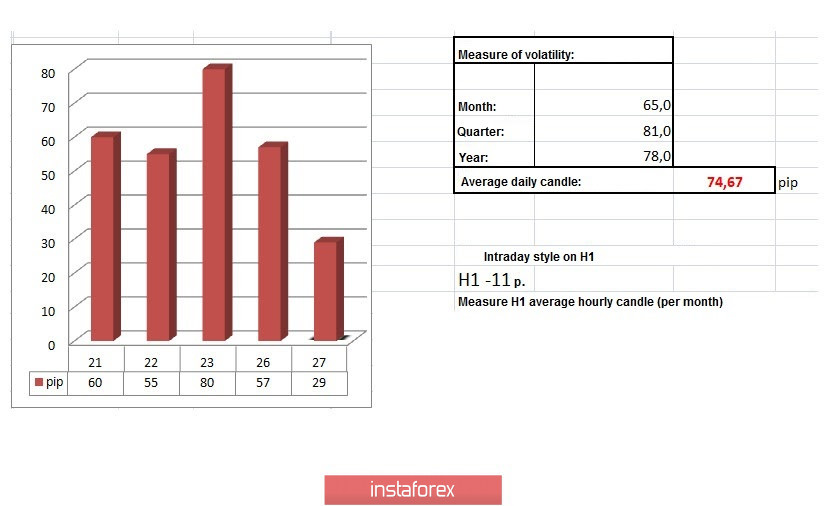
In terms of daily dynamics, 57 points were recorded yesterday, which is 23% below the average. At the same time, speculative local activity was observed in the market during the European session.
Looking at the trading chart in general terms (daily period), you can see an upward turn from September 28, but at the same time, the market takes a sideways trend from July 31, which is still relevant in the market.
Yesterday's news background contained data on new home sales in the United States, where there was a forecasted growth of 3.5%, but as a result, it received a decline of -3.5%. Such a sharp divergence negatively affected the US dollar.
In terms of information flow, the noise about COVID-19 is gaining impulse again, where there is a steady growth in cases of infection around the world. So in Europe, where highs are updated weekly, new restrictive measures are being discussed, in particular the tightening of quarantine and the extension of the curfew for six months.
In the United States, new COVID-19 cases were recorded since last Spring. The detected infections are from 75 thousand to 85 thousand. However, they are not yet focusing attention to this due to the upcoming presidential elections, but everything may soon change.
For the economic calendar, we have data on the volume of orders for durable goods in the US today, where there is a forecasted growth of 0.4%, which may have a positive effect on the USD price.
Further development
Analyzing the current trading chart, we can see that the quote remains at the level of 1.1810, considering it as a pivot point, where a local surge in short positions appeared at the start of the European session. We can assume that a price consolidation below 1.1800 will lead us to the base of the zigzag pattern - 1.1787/1.1880, where the breakdown of this value will be considered key in the upcoming growth.
As long as the first part of the forecast does not match, the risk of a price rebound from 1.1810 will remain in the market, where it is worth considering a mirror image. That is, a price consolidation above the level of 1.1840 leads to a movement to 1.1860, while a consolidation above 1.1880, will allow the zigzag-shaped pattern to move in an upward direction.
Indicator analysis
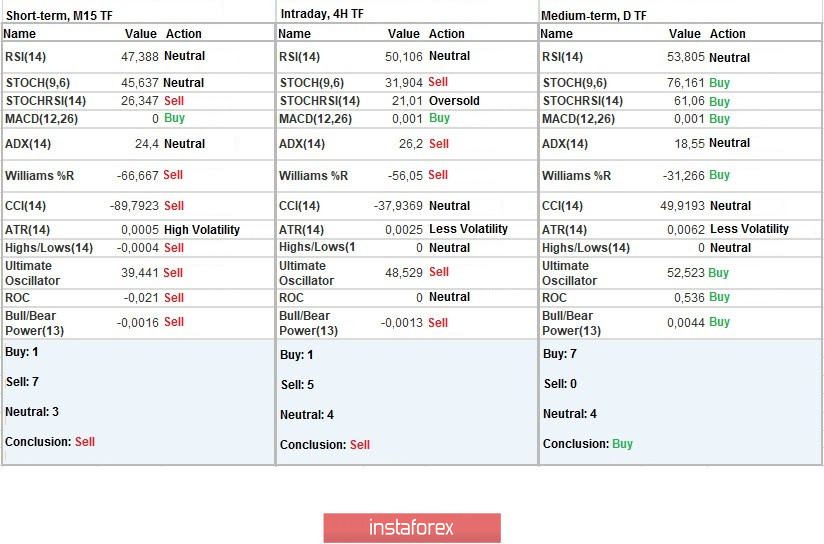
Analyzing different sectors of time frames (TF), we can see that technical indicators on the minute and hourly TFs have a sell signal due to price fluctuations within the level of 1.1810. The daily TF, as before, considers the four-week move as the main one, signaling a buy.
Weekly volatility / Volatility measurement: Month; Quarter; Year
Measurement of volatility reflects the average daily fluctuation, calculated per Month / Quarter / Year.
The current time volatility is 29 points, which is even lower than the average level by 61%. If the zigzag-shaped model is consistently broken, acceleration will occur, which will lead to an increase in volatility.
Key levels
Resistance zones: 1.1880; 1.1910; 1.2000 ***; 1.2100 *; 1.2450 **; 1.2550; 1.2825.
Support zones: 1.1810; 1.1787 *; 1.1700; 1.1650 *; 1,1500; 1.1350; 1.1250 *; 1.1180 **; 1.1080; 1.1000 ***.
* Periodic level
** Range level
*** Psychological level
*Phân tích thị trường được đăng tải ở đây có nghĩa là để gia tăng nhận thức của bạn, nhưng không đưa ra các chỉ dẫn để thực hiện một giao dịch.
InstaSpot analytical reviews will make you fully aware of market trends! Being an InstaSpot client, you are provided with a large number of free services for efficient trading.


