


Huyền thoại trong nhóm InstaSpot!
Huyền thoại! Bạn nghĩ rằng đó là lời nói khoa trương? Nhưng chúng ta nên gọi một người đàn ông như thế nào, người đã trở thành người châu Á đầu tiên giành chức vô địch cờ vua thế giới lứa tuổi thiếu niên năm 18 tuổi và người trở thành Đại kiện tướng Ấn Độ đầu tiên năm 19 tuổi? Đó là khởi đầu cho con đường khó khăn đến danh hiệu Vô địch Thế giới của Viswanathan Anand, người đàn ông đã trở thành một phần của lịch sử cờ vua mãi mãi. Giờ đây, một huyền thoại nữa trong nhóm InstaSpot!


Borussia là một trong những câu lạc bộ bóng đá danh giá nhất nước Đức, đã nhiều lần chứng minh cho người hâm mộ thấy: tinh thần thi đấu và sự lãnh đạo chắc chắn sẽ dẫn đến thành công. Giao dịch theo cách mà các chuyên gia thể thao chơi trò chơi: tự tin và chủ động. Giữ một "đường chuyền" từ Borussia FC và dẫn đầu với InstaSpot!
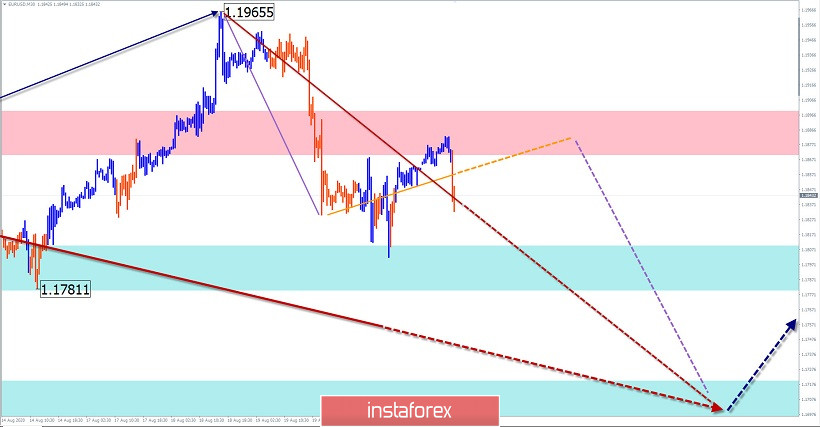
EUR/USD
Analysis:
The direction of the trend of the European currency since mid-March is set by the algorithm of the rising wave from March 20. The growth of the pair brought the price within the boundaries of a wide reversal zone of a large scale. In the last 3 weeks, the quotes form a stretched plane. The wave structure doesn't look complete.
Forecast:
In the coming day, it is expected to complete the rollback that began yesterday, turn around and return to the downward movement vector. Long-range support shows the expected end zone of the entire current correction.
Potential reversal zones
Resistance:
- 1.1870/1.1900
Support:
- 1.1810/1.1780
- 1.1720/1.1690
Recommendations:
The current decline is against the direction of the euro trend. Intraday supporters can make short-term sales. The optimal tactic is to refrain from trading during the correction, with the search for buy signals at the end of it.
USD/JPY
Analysis:
The direction of the short-term trend of the Japanese yen is set by the algorithm of the downward wave from June 5, which completes a larger bearish structure. In its structure, the final part (C) has been developing since August 12. In the last 2 days, the price formed an intermediate pullback.
Forecast:
In the coming day, we expect the end of the upward movement rate, a reversal and the beginning of a downward price move. The near-term support may delay the rate of decline. Most activity is likely at the end of the day.
Potential reversal zones
Resistance:
- 106.00/106.30
Support:
- 105.30/105.00
- 104.50/104.20
Recommendations:
Buying a pair today can be unprofitable. It is recommended to focus on searching for sales signals.

Explanation: In the simplified wave analysis (UVA), waves consist of 3 parts (A-B-C). The last incomplete wave is analyzed. The solid background of arrows shows the formed structure, and the dotted ones show the expected movements.
Note: The wave algorithm does not take into account the duration of the tool movements in time!
*Phân tích thị trường được đăng tải ở đây có nghĩa là để gia tăng nhận thức của bạn, nhưng không đưa ra các chỉ dẫn để thực hiện một giao dịch.
InstaSpot analytical reviews will make you fully aware of market trends! Being an InstaSpot client, you are provided with a large number of free services for efficient trading.


