


Huyền thoại trong nhóm InstaSpot!
Huyền thoại! Bạn nghĩ rằng đó là lời nói khoa trương? Nhưng chúng ta nên gọi một người đàn ông như thế nào, người đã trở thành người châu Á đầu tiên giành chức vô địch cờ vua thế giới lứa tuổi thiếu niên năm 18 tuổi và người trở thành Đại kiện tướng Ấn Độ đầu tiên năm 19 tuổi? Đó là khởi đầu cho con đường khó khăn đến danh hiệu Vô địch Thế giới của Viswanathan Anand, người đàn ông đã trở thành một phần của lịch sử cờ vua mãi mãi. Giờ đây, một huyền thoại nữa trong nhóm InstaSpot!


Borussia là một trong những câu lạc bộ bóng đá danh giá nhất nước Đức, đã nhiều lần chứng minh cho người hâm mộ thấy: tinh thần thi đấu và sự lãnh đạo chắc chắn sẽ dẫn đến thành công. Giao dịch theo cách mà các chuyên gia thể thao chơi trò chơi: tự tin và chủ động. Giữ một "đường chuyền" từ Borussia FC và dẫn đầu với InstaSpot!
Did the strength change? Metals down – dollar up? Here's a comprehensive analysis of movement options of #USDX vs Gold & Silver (H4) for March 13, 2020
Minuette operational scale (H4)
____________________
US dollar index
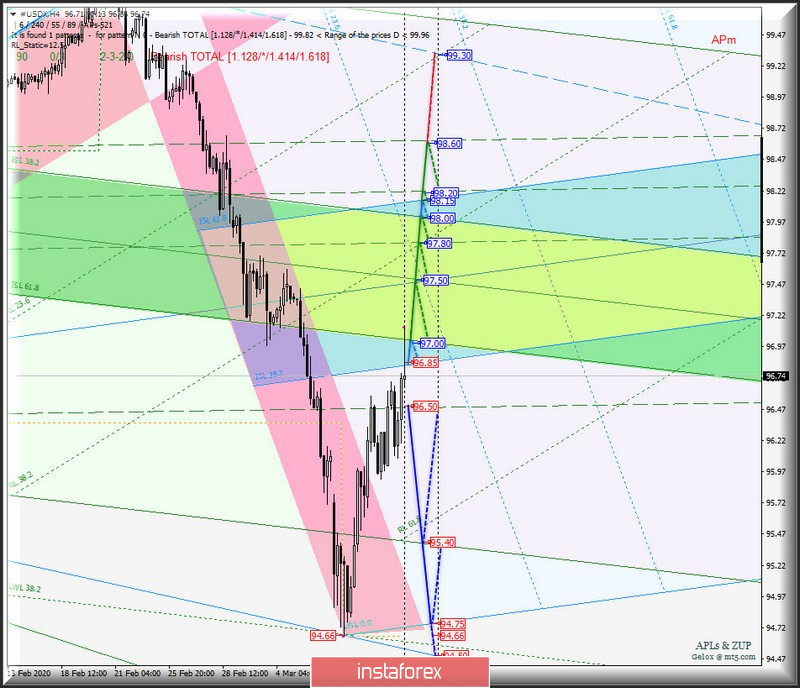
The movement #USDX to March 13, 2020 due to the processing and the direction of the breakdown range :
The breakdown of ISL38.2 (resistance level of 96.85) Minuette, followed by breakdown of ISL61.8 Minuette (97.00) will determine the development of the movement of the dollar index within the boundaries of the equilibrium zones of the Minuette operational scale forks (96.85 - 97.50 - 98.15) and Minuette (97.00 - 97.50 - 98.00), as well as the 1/2 Median Line Minuette channel (97.80 - 98.20 - 98.60).
On the other hand, the breakdown of the final Schiff Line Minuette (support level of 96.50) will enable the development of the downward movement of #USDX to the final FSL line (95.40) of the Minuette operational scale forks and initial line SSL (94.75) of the Minuette operational scale forks.
The markup of #USDX movement options from March 13, 2020 is shown on the animated chart.
____________________
Spot Gold
From March 13, 2020, the development of the Spot Gold movement will continue to be determined by the development and direction of the breakdown of the boundaries of 1/2 Median Line channel (1639.88 - 1620.00 - 1600.20) of the Minuette operational scale forks. The details of the movement of Spot Gold is presented on the animated chart.
The breakdown of the lower boundary of the 1/2 Median Line Minuette channel (support level of 1600.00) will determine the development of Spot Gold movement within the boundaries of the equilibrium zones of the Minuette operational scale forks (1603.00 - 1578.00 - 1555.00) and Minuette (1600.00 - 1573.00 - 1546.00).
Alternatively, in case of breakdown of the upper boundary (resistance level of 1639.88) of the 1/2 Median Line channel of the Minuette operational scale forks is an option for the development of Spot Gold upward movement to the initial SSL line (1666.00) of the Minuette operational scale forks and SSL Minuette start line (1690.00).
The details of the Spot Gold movement options from March 13, 2020 are shown on the animated chart.

____________________
Spot Silver
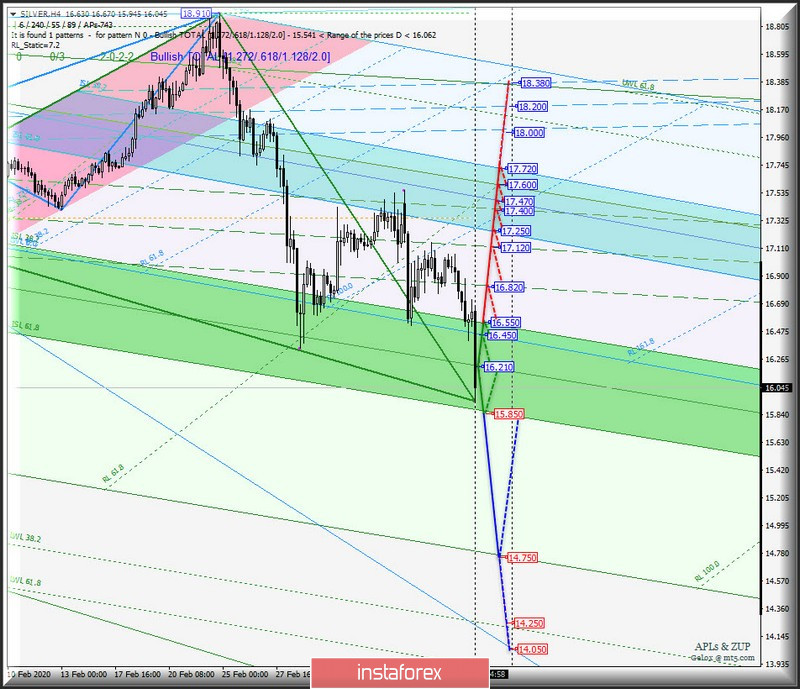
The development and direction of the breakdown of the boundaries of the equilibrium zone (16.550 - 16.210 - 15.850) of the Minuette operational scale forks will begin to determine the development of the Spot Silver movement from March 13, 2020. We look at the details of the development of the indicated levels on the animated chart.
The breakdown of the support level of 15.850 at the lower boundary of the ISL61.8 equilibrium zone of the Minuette operational scale forks is a continuation of the downward movement of Spot Silver to the final line FSL Minuette (14.750).
In contrast, the breakdown of the resistance level of 16.550 on the upper boundary of the ISL38.2 equilibrium zone of the Minuette operational scale forks, the Spot Silver movement will be directed to the boundaries of the 1/2 Median Line Minuette channel (16.820 - 17.120 - 17.400) and the equilibrium zone (17.250 - 17.470 - 17.720) of the Minuette operational scale forks.
The details of the Spot Silver movement from March 13, 2020 can be seen on the animated chart.
____________________
The review is made without taking into account the news background. Thus, the opening of trading sessions of major financial centers does not serve as a guide to action (placing orders "sell" or "buy").
The formula for calculating the dollar index :
USDX = 50.14348112 * USDEUR0.576 * USDJPY0.136 * USDGBP0.119 * USDCAD0.091 * USDSEK0.042 * USDCHF0.036.
where the power coefficients correspond to the weights of the currencies in the basket:
Euro - 57.6% ;
Yen - 13.6% ;
Pound Sterling - 11.9% ;
Canadian dollar - 9.1%;
Swedish krona - 4.2%;
Swiss franc - 3.6%.
The first coefficient in the formula leads the index to 100 at the starting date - March 1973, when the main currencies began to be freely quoted relative to each other.
*Phân tích thị trường được đăng tải ở đây có nghĩa là để gia tăng nhận thức của bạn, nhưng không đưa ra các chỉ dẫn để thực hiện một giao dịch.
InstaSpot analytical reviews will make you fully aware of market trends! Being an InstaSpot client, you are provided with a large number of free services for efficient trading.


