


Đội ngũ của chúng tôi có hơn 7,000,000 thương nhân!
Hàng ngày chúng tôi làm việc cùng nhau để cải thiện việc giao dịch. Chúng tôi nhận được kết quả cao và luôn tiến lên phía trước.
Sự công nhận của hàng triệu thương nhân trên toàn thế giới là sự đánh giá tốt nhất cho công việc của chúng tôi! Bạn đã đưa ra quyết định của mình và chúng tôi sẽ làm mọi thứ cần thiết để đáp ứng mong đợi của bạn!
Chúng ta cùng với nhau sẽ là một nhóm tuyệt vời!
InstaSpot. Tự hào làm việc cho bạn!


Diễn viên, nhà vô địch mùa giải UFC 6 và là người hùng thật sự!
Người tự mình làm nên tất cả. Người đàn ông đáng kể học hỏi.
Bí mật đằng sau thành công của Taktarov là sự cố gắng liên tục hướng tới mục tiêu.
Hãy khai phá tất cả các mặt tài năng của bạn!
Khám phá, thử, thất bại - nhưng không bao giờ dừng lại!
InstaSpot. Câu chuyện thành công của bạn bắt đầu từ đây!
4-hour timeframe
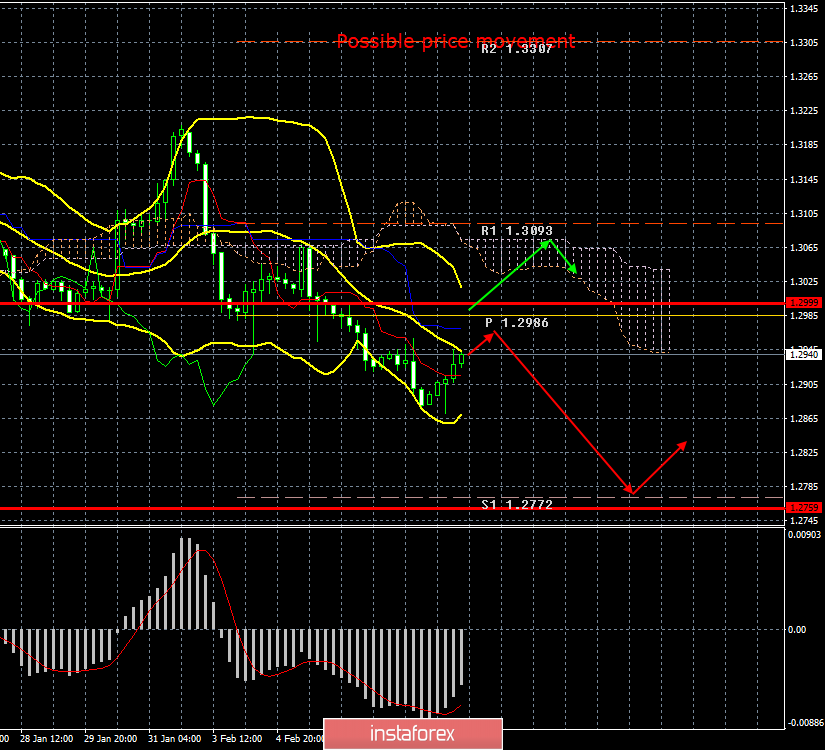
Amplitude of the last 5 days (high-low): 217p - 106p - 114p - 79p - 80p.
Average volatility over the past 5 days: 120p (high).
The pound sterling paired with the US currency on February 10 began a weak upward correction. We expected exactly the same development of events from the EUR/USD pair, but only the pound/dollar pair began to adjust. Although, from our point of view, the British currency is generally quite overbought, despite the fact that in recent years it has only become cheaper. The first trading day was rather boring and uninteresting, since no macroeconomic publications were planned for that day. Thus, traders decided to consolidate part of the position before an extremely important Tuesday, when a large amount of important macroeconomic information will be published. By and large, the pound will depend on tomorrow. If, on the whole, macroeconomic statistics turn out to be at least not a failure, then perhaps the upward correction will continue. There is very little hope of Jerome Powell in Congress. It is unlikely that out of the blue, following strong reports on the US labor market, the Fed chief will change his rhetoric to a dovish one. Thus, Powell's speech at best will simply not trigger new purchases of the US dollar.
But it is extremely difficult to expect the same effect from UK statistics. In principle, only one indicator of GDP is enough, which according to preliminary estimates should slow down from 1.1% to 0.8% in the fourth quarter. Of course, GDP can be, for example, 1.0%, which will still be worse than the previous value and above the forecast. Traders can decide that not everything is so bad, and not continue to sell the pound. Thus, it is not a fact that tomorrow we will definitely see a fall in the British currency. But all market participants are well aware that in the long term, the pound will still be subject to decline, since nothing in the UK is changing for the better. All risks relating to Brexit remain. All risks relating to negotiations with the European Union on a trade agreement remain. The economy continues to lose money. What will happen after 2020 is not known at all. Thus, our forecasts for the whole of 2020 remain the same - a fall and only a fall. It may not be a landslide, it may not be panic, it may not be quick, but it will fall.
What to expect from a currency pair in technical terms? First, the movement to the critical line. If the pair reaches this line and bounces off it, then the downward movement will resume, and traders will receive an eloquent signal for selling the pound sterling. Secondly, the preservation of a long-term downward movement, as on the 24-hour chart Bollinger bands began to expand downward, which indicates the completion of a 5-month upward trend.
Trading recommendations:
GBP/USD began to adjust against the "dead cross". Thus, selling the pound with the target support level of 1.2772 is still relevant, but after the completion of the current correction, which can be determined by the rebound from the Kijun-sen line or by turning the MACD indicator down. Purchases of a pair by small lots can be considered if the price returns to the area above the Kijun-sen line with the first goal of the Senkou Span B. line
Explanation of the illustration:
Ichimoku indicator:
Tenkan-sen is the red line.
Kijun-sen is the blue line.
Senkou Span A - light brown dotted line.
Senkou Span B - light purple dashed line.
Chikou Span - green line.
Bollinger Bands Indicator:
3 yellow lines.
MACD indicator:
Red line and bar graph with white bars in the indicators window.
Support / Resistance Classic Levels:
Red and gray dashed lines with price symbols.
Pivot Level:
Yellow solid line.
Volatility Support / Resistance Levels:
Gray dotted lines without price designations.
Possible price movements:
Red and green arrows.
*Phân tích thị trường được đăng tải ở đây có nghĩa là để gia tăng nhận thức của bạn, nhưng không đưa ra các chỉ dẫn để thực hiện một giao dịch.
InstaSpot analytical reviews will make you fully aware of market trends! Being an InstaSpot client, you are provided with a large number of free services for efficient trading.


