


ทีมงานของพวกเรา พร้อมกับเทรดเดอร์มากกว่า 7,000,000 คน!
ในทุกวัน พวกเราได้รวมงานร่วมกันเพื่อพัฒนาการเทรด พวกเรามีผลตอบรับที่ดี และยังเดินหน้าต่อไป
การยอมรับจากเทรดเดอร์นับล้านจากทั่วทุกมุมโลกนั้นเป็น ผลงา่นอันน่าประทับใจมากที่สุดของพวกเรา! คุณเลือกตัวเลือก และพวกเราจะจัดการทุกอย่างให้ตรงกับการคาดหวังของคุณ !
พวกเราเป็นทีมงานที่ดีที่สุด!
InstaSpot รู้สึกเป็นเกียรติที่ได้ร่วมงานกับคุณ !


นักแสดง, แชมป์เปี้ยนทัวร์นาเม้น UFC 6 และฮิโรที่แท้จริง !
ชายผู้สามารถก่อร่างสร้างตัวขึ้นมาได้ด้วยตัวเขาเอง ชายผู้ที่นำพาเส้นทางให้พวกเรา
ความลับที่อยู่เบื้องหลังความสำเร็จของ Taktarov ก็คือการมุ่งหน้าไปสู่เป้าหมายแบบทันที
เปิดเผยทุกด้านของความสำเร็จคุณ !
ค้นพบ, พยายาม, ผิดพลาดได้ แต่อย่าพึ่งหยุดยั่ง !
InstaSpot ที่พร้อมจะเป็นจุดเริ่มต้น เรื่องราวความสำเร็จของคุณ !

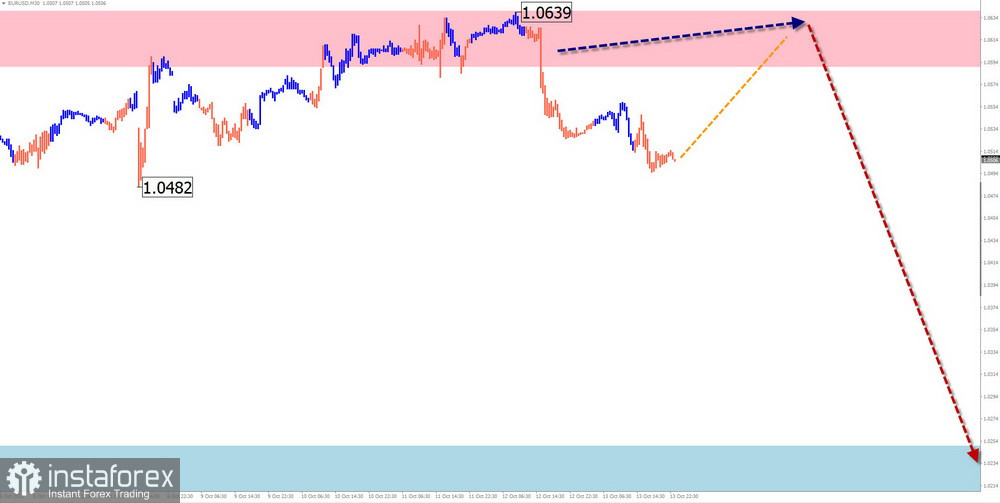
EUR/USD
Analysis:
Within the dominant bearish trend of the euro chart since late September, a corrective wave is forming, which has not exceeded the correction of the last segment. At the time of the analysis, the wave structure is incomplete, with the final part (C) nearing completion.
Forecast:
In the upcoming week, following a consolidation period, a continuation of the euro's trend wave is expected. Short-term growth is possible in the first few days, with the possibility of pressure on the upper boundary of the resistance zone. Afterwards, a reversal is likely to occur, and the bearish trend of the euro is expected to resume.
Potential Reversal Zones
Resistance:
Support:
Recommendations:
Sales: This will become possible after the appearance of corresponding reversal signals in the resistance zone you use for your trading strategy.
Purchases: have limited potential and involve a high degree of risk.
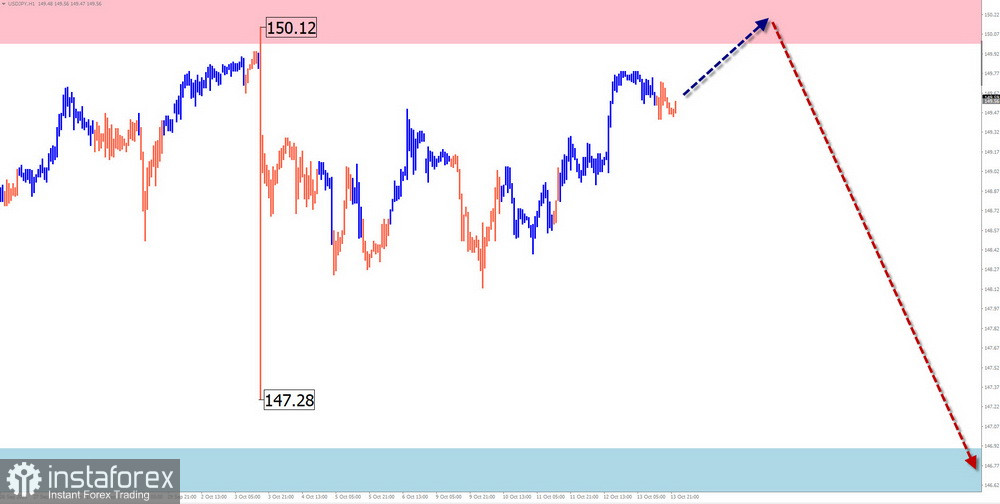
USD/JPY
Analysis:
The dominant upward wave of the pair since August has brought the quotes to a strong potential reversal zone over a large time frame. Analysis of the wave structure shows the formation of a flat correction since October 3rd, which has not yet been completed at the time of analysis. Without the formation of a complete correction, further upward breakthroughs are unlikely.
Forecast:
The beginning of the upcoming week is expected to be in a sideways range, with the price moving along the resistance zone. Pressure on this zone is possible, with a brief break above its upper boundary. In the second half of the week, a change in direction, increased volatility, and the start of a price decline for the pair are expected.
Potential Reversal Zones
Resistance:
Support:
Recommendations:
Sales: This will become relevant after the appearance of confirmed reversal signals in the resistance zone.
Purchases: No favorable market conditions for such transactions are present.
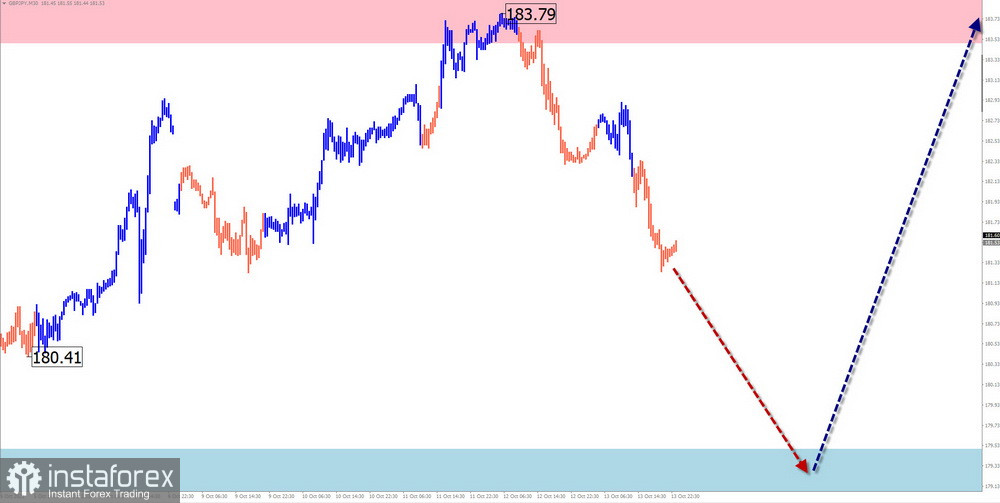
GBP/JPY
Analysis:
The unfinished segment of the dominant upward trend of the GBP/JPY pair has been counting since July 28th. The price has reached the lower boundary of a potentially significant reversal zone on a large-scale chart. In the wave structure, a corrective part (B) in the form of a shifting flat has been forming over the past two months.
Forecast:
In the upcoming week, a continuation of price movement within the corridor between the nearest zones in the opposite direction is expected. A descending vector is more likely in the first half, with a decline expected towards support levels. A return to the bullish course is likely at the beginning of the following week.
Potential Reversal Zones
Resistance:
Support:
Recommendations:
Sales: Possible with reduced volume within the intraday framework.
Purchases: will become relevant after the appearance of confirmed reversal signals in the support zone, according to your trading system (TS).
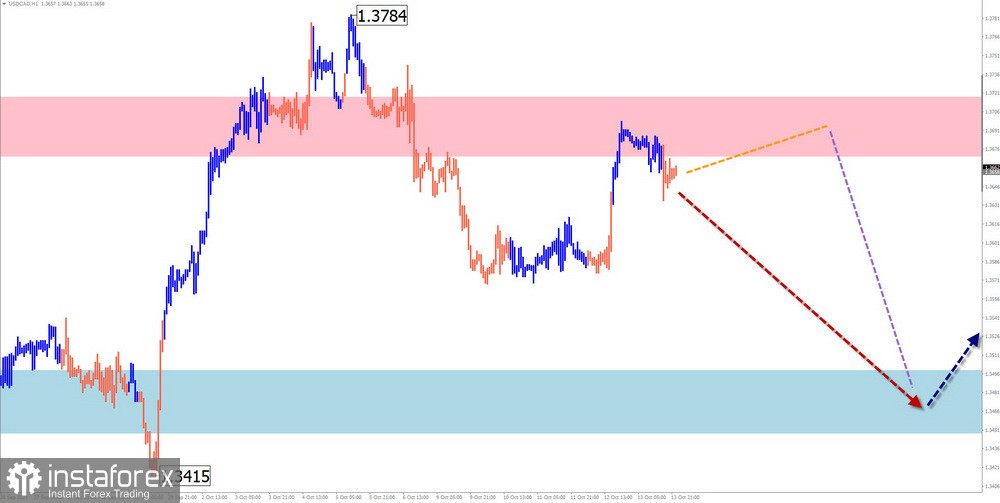
USD/CAD
Analysis:
Since July of this year, the Canadian dollar has been following an ascending trend. Quotes have reached the boundaries of a strong resistance zone in a longer time frame. Since October 5th, quotes have been forming an unfinished correction segment. Last week, the price mostly moved horizontally.
Forecast:
At the beginning of the upcoming week, a continuation of the overall sideways sentiment is expected along resistance levels. Subsequently, a change in direction and a resumption of the bearish price movement for the pair are likely. A decline can be expected up to the calculated support levels.
Potential Reversal Zones
Resistance:
Support:
Recommendations:
Sales: This will be relevant after the appearance of reversal signals in the resistance zone on your trading system.
Purchases: In the next few days, they won't have much potential.
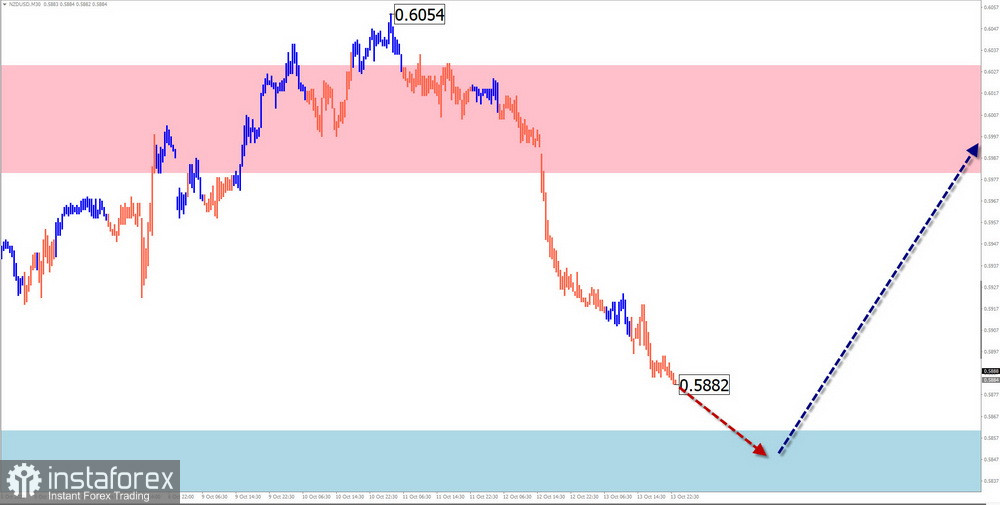
NZD/USD
Brief Analysis:
Since December of last year, the New Zealand dollar market has been pushing the price down in the main pair. The trend segment that began on July 14th remains unfinished today. In its structure, throughout October, quotes are forming a horizontal correction (B), which is still ongoing. The price is approaching the upper boundary of a strong weekly support zone.
Weekly Forecast:
In the upcoming week, the "kiwi" price is expected to continue the overall sideways course. In the first few days, a decrease is likely down to the support zone. Subsequently, a change in direction is probable, and price growth can be expected up to the resistance boundaries.
Potential Reversal Zones
Resistance:
Support:
Recommendations:
Purchases: will become relevant after the appearance of corresponding reversal signals in the resistance zone.
Sales: may lead to losses and are not recommended.
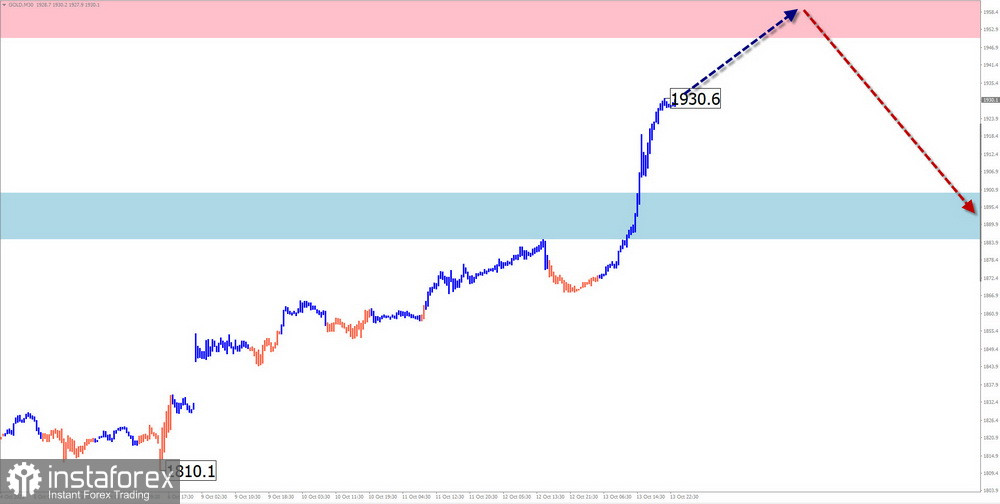
GOLD
Analysis:
A descending wave had been determining the price trend of gold until recently. Starting on October 3rd, an upward wave with reversal potential began. Its current wave level allows us to attribute the ongoing rise to the D1 chart scale.
Forecast:
In the upcoming week, a continuation of the price increase that started last week is expected. The most likely area for the end of the rise is the calculated resistance. Subsequently, a reversal formation is expected, marking the beginning of a downward correction.
Potential Reversal Zones
Resistance:
Support:
Recommendations:
Sales: Have limited potential.
Purchases: This can become the primary direction for trading the pair when confirmed reversal signals are present.
Note: In simplified wave analysis (SWA), all waves consist of three parts (A, B, and C). The analysis focuses on the last unfinished wave in each time frame. Dotted lines indicate expected movements.
Attention: The wave algorithm does not consider the duration of pair's movements in time.
*บทวิเคราะห์ในตลาดที่มีการโพสต์ตรงนี้ เพียงเพื่อทำให้คุณทราบถึงข้อมูล ไม่ได้เป็นการเจาะจงถึงขั้นตอนให้คุณทำการซื้อขายตาม
บทวิเคราะห์ของทาง InstaSpot จะทำให้คุณทราบถึงแนวโน้มของตลาด! ในการที่เป็นลูกค้าของทาง InstaSpot นั้นคุณจะได้รับการบริการเพื่อการซื้อขายอย่างเต็มประสิทธิภาพอย่างมากมาย


