


EUR/USD
Analysis:
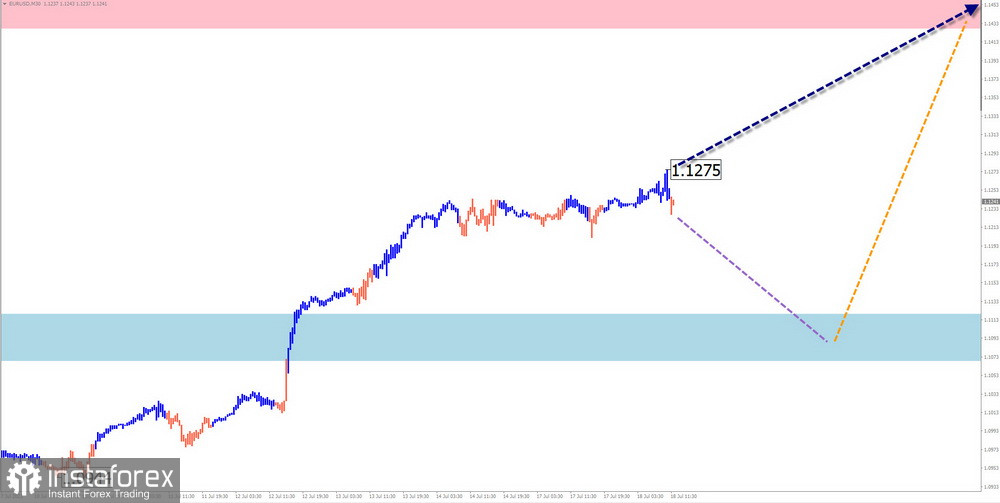
On the chart of the major European currency pair, the dominant ascending trend of the past year continues. After breaking through the daily resistance, the quotes continued their path toward the upper part of the price chart. The calculation of the preliminary target zone indicates potential growth potential in the area of five price figures.
Forecast:
In the upcoming week, the dominance of the bullish price movement vector for the euro is expected to continue. At the beginning of the week, a temporary downward correction toward the support zone cannot be excluded. After that, a reversal formation and a resumption of the upward price movement can be expected.
Potential Reversal Zones:
Resistance:
1.1430/1.1480
Support:
1.1120/1.1070
Recommendations:
Sell: There will be no conditions for such trades next week.
Buy: Buying positions can be profitable when monitoring emerging reversal signals near the support zone.
USD/JPY
Analysis:
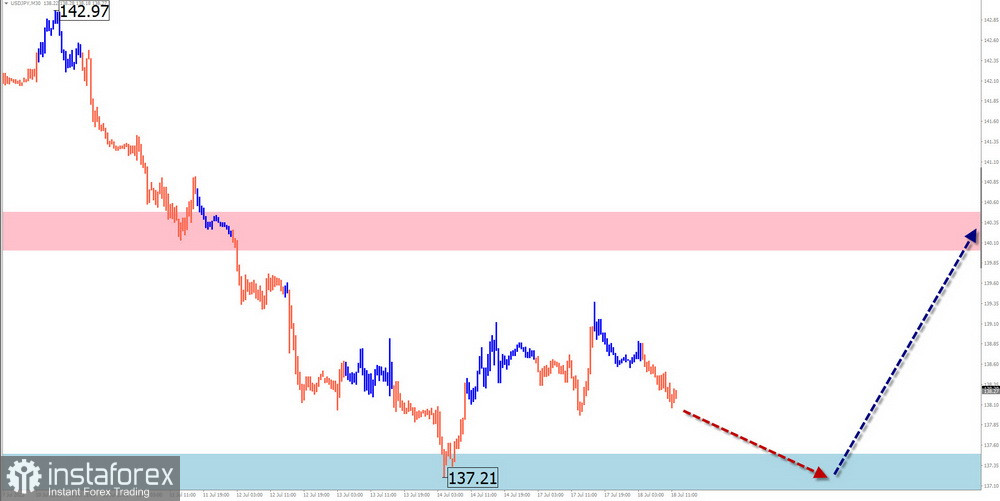
The daily chart scale of the main Japanese yen pair demonstrates the formation of a descending wave pattern since October of the previous year. On June 30th, the first segment of the final part of the wave (C) started its downward movement. The price reached the upper boundary of a powerful potential reversal zone. Conditions for the formation of an intermediate correction have been created.
Forecast:
At the beginning of the upcoming week, the bearish price movement vector is expected to be completed. A reversal formation can be expected in the area of the calculated support. When changing course, a temporary breakthrough below the lower boundary of the zone cannot be ruled out. The resumption of an upward course is more likely towards the end of the week.
Potential Reversal Zones:
Resistance:
140.00/140.50
Support:
137.50/137.00
Recommendations:
Sell: risky and can lead to account losses.
Buy: Buying positions can be profitable when monitoring emerging reversal signals near the support zone.
GBP/JPY
Analysis:
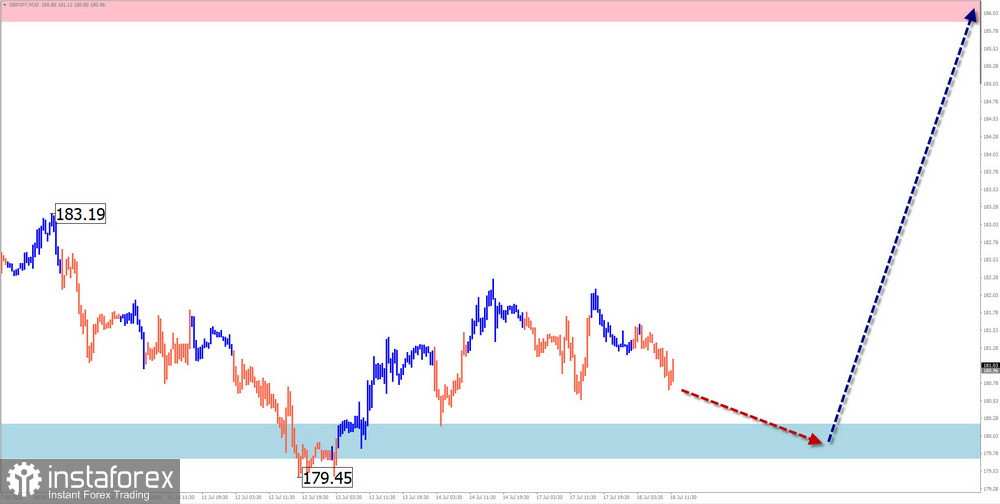
The pound/yen pair's rate movement is directed towards the "north" of the price chart. The trend in the highest time frame confirms this trend. The price has reached the boundaries of the potential reversal zone on a weekly scale. In its structure, a counter-movement has been developing in a sideways direction for the entire last month. At the time of analysis, it had not exceeded the boundaries of the correction.
Forecast:
At the beginning of the upcoming week, the continuation of the sideways price movement vector can be expected until the completion of the corrective wave. Then, a reversal and resumption of the upward course can be expected for the currency pair. A breakthrough of the upper boundary of the expected range during the upcoming week is unlikely.
Potential Reversal Zones:
Resistance:
185.90/186.40
Support:
180.20/179.70
Recommendations:
Sell: Selling positions can be profitable with reduced lot sizes within individual sessions. It is recommended to close trades at the first signs of a reversal.
Buy: Buying positions will become relevant after signals of a change in direction appear near the calculated support zone.
USD/CAD
Analysis:
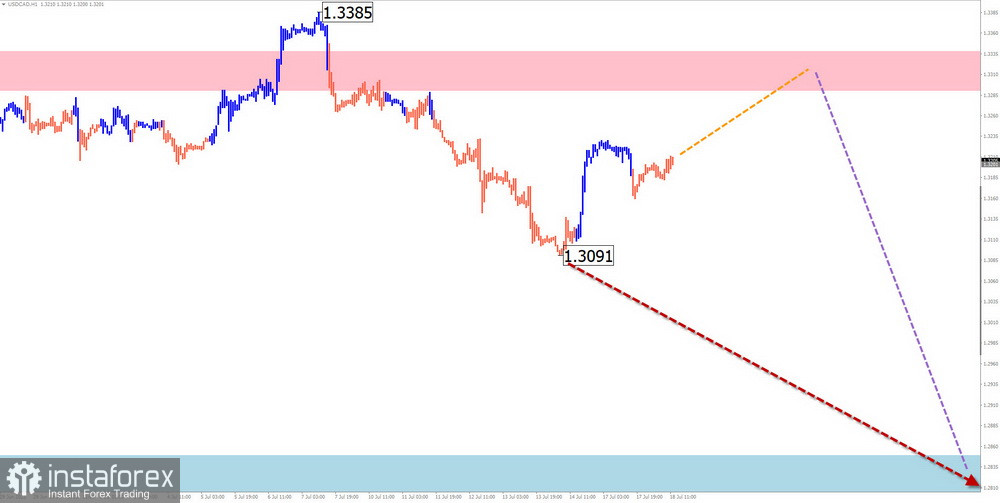
The price movement of the Canadian dollar in the main pair has been determined by a descending wave algorithm since September of last year. Looking at the weekly chart scale, it shows the corrective nature of this movement. In the last month and a half, the price has been predominantly moving sideways, along the upper boundary of the potential reversal zone on the weekly timeframe.
Forecast:
At the beginning of next week, a continuation of the upward vector is expected, leading to the complete end of the current rally. By the end of the week, a reversal and a resumption of the bearish direction of movement can be expected. Sharp volatility spikes are possible against the backdrop of important news releases.
Potential Reversal Zones
Resistance:
1.3290/1.3340
Support:
1.2850/1.2800
Recommendations:
Buy: Buying positions may be profitable within individual sessions with reduced lot sizes. It is recommended to close trades at the first reversal signal.
Sell: Selling positions will become relevant after signals indicate a change in direction around the calculated support area. Reducing lot size is safer.
NZD/USD
Brief analysis:
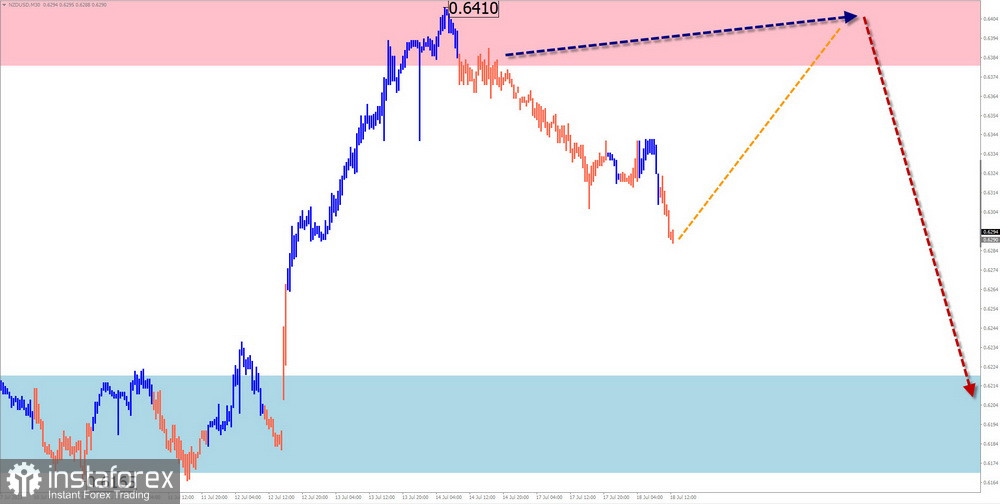
On the chart of the New Zealand dollar's main pair, an ascending wave zigzag has been forming since September last year. The final part (C) is counted starting May 31st. The price has reached the lower boundary of a strong potential reversal zone on the weekly scale. The downward section since July 14th has reversal potential. If confirmed, it will begin a new bearish wave in the short-term trend.
Weekly forecast:
Sideways movement can be expected during the upcoming week. An ascent towards the resistance zone is probable. A reversal is anticipated around the resistance zone, followed by a further decline toward the support zone. A temporary breakthrough of the upper resistance boundary cannot be ruled out upon a change in direction. The highest volatility is likely towards the end of the week.
Potential Reversal Zones
Resistance:
0.6380/0.6430
Support:
0.6220/0.6170
Recommendations:
Sell: After confirmed reversal signals appear, selling positions can become the main direction for trading.
Buy: Buying positions can be used with fractional lot sizes within individual sessions. The potential is limited by resistance.
GOLD
Analysis:
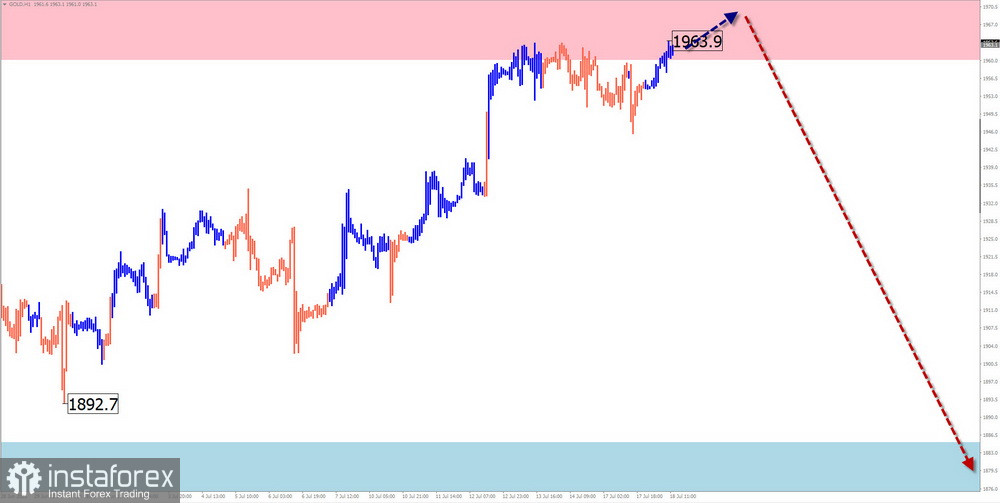
As of the analysis moment, the last incomplete wave structure of the gold index is counted from the end of September of last year. Since March 20th, the price has formed a counter-correction part (B) in this ascending wave. The wave is predominantly developing sideways. The structure needs a complete section.
Forecast:
At the beginning of the current week, the completion of the upward vector of the price movement can be expected up to the completion of the price rise in the calculated resistance area. By the end of the week, the probability of a direction change and the start of a gold price decline increases, approaching resistance levels. The support zone represents the lower boundary of the expected weekly movement of the instrument.
Potential Reversal Zones
Resistance:
1960.0/1975.0
Support:
1885.0/1870.0
Recommendations:
Sell: After the appearance of corresponding confirmed signals from your trading system, selling positions can become the main direction for trading.
Buy: Risky, may result in losses. It is optimal to stay out of the market for the instrument until reversal signals appear.
Note: In simplified wave analysis (SWA), all waves consist of 3 parts (A-B-C). The last incomplete wave is analyzed at each timeframe. Dashed lines indicate expected movements.
Attention: Wave algorithms do not consider the duration of instrument movements over time!
*บทวิเคราะห์ในตลาดที่มีการโพสต์ตรงนี้ เพียงเพื่อทำให้คุณทราบถึงข้อมูล ไม่ได้เป็นการเจาะจงถึงขั้นตอนให้คุณทำการซื้อขายตาม
บทวิเคราะห์ของทาง InstaSpot จะทำให้คุณทราบถึงแนวโน้มของตลาด! ในการที่เป็นลูกค้าของทาง InstaSpot นั้นคุณจะได้รับการบริการเพื่อการซื้อขายอย่างเต็มประสิทธิภาพอย่างมากมาย


