


ทีมงานของพวกเรา พร้อมกับเทรดเดอร์มากกว่า 7,000,000 คน!
ในทุกวัน พวกเราได้รวมงานร่วมกันเพื่อพัฒนาการเทรด พวกเรามีผลตอบรับที่ดี และยังเดินหน้าต่อไป
การยอมรับจากเทรดเดอร์นับล้านจากทั่วทุกมุมโลกนั้นเป็น ผลงา่นอันน่าประทับใจมากที่สุดของพวกเรา! คุณเลือกตัวเลือก และพวกเราจะจัดการทุกอย่างให้ตรงกับการคาดหวังของคุณ !
พวกเราเป็นทีมงานที่ดีที่สุด!
InstaSpot รู้สึกเป็นเกียรติที่ได้ร่วมงานกับคุณ !


นักแสดง, แชมป์เปี้ยนทัวร์นาเม้น UFC 6 และฮิโรที่แท้จริง !
ชายผู้สามารถก่อร่างสร้างตัวขึ้นมาได้ด้วยตัวเขาเอง ชายผู้ที่นำพาเส้นทางให้พวกเรา
ความลับที่อยู่เบื้องหลังความสำเร็จของ Taktarov ก็คือการมุ่งหน้าไปสู่เป้าหมายแบบทันที
เปิดเผยทุกด้านของความสำเร็จคุณ !
ค้นพบ, พยายาม, ผิดพลาดได้ แต่อย่าพึ่งหยุดยั่ง !
InstaSpot ที่พร้อมจะเป็นจุดเริ่มต้น เรื่องราวความสำเร็จของคุณ !

EUR/USD
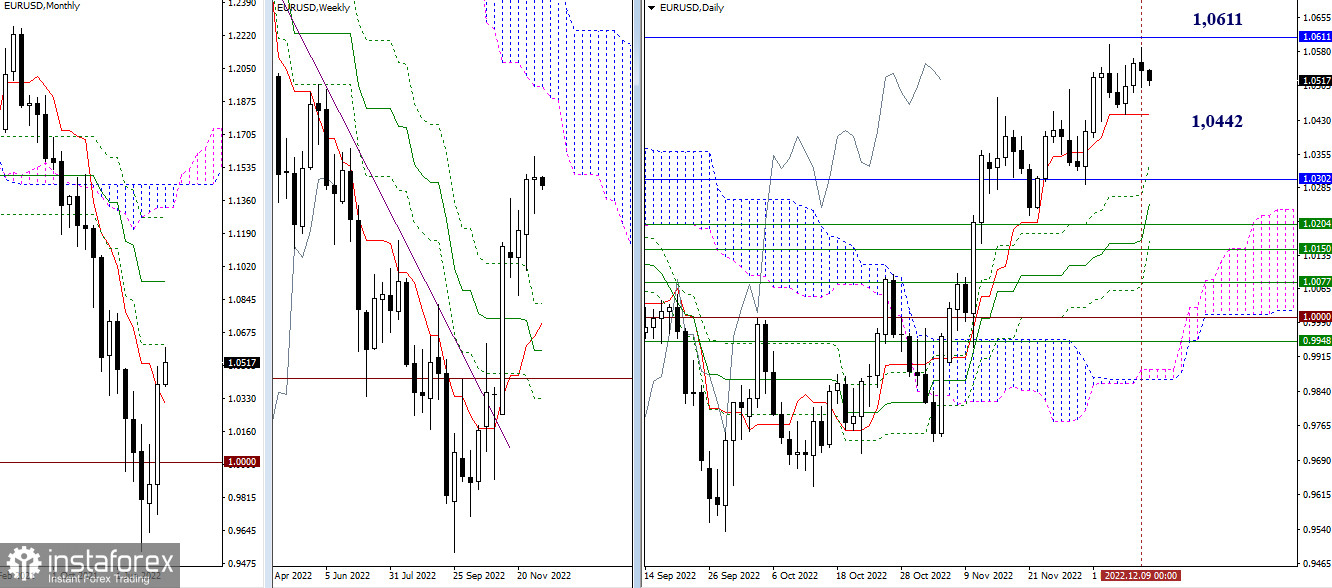
Higher time frames
The pair closed last week with a vaguely formed candlestick. Bulls tested the monthly resistance level of 1.0611 but failed to break through it. At the same time, bears were also lacking momentum to take over the market. So, the two forces continue to compete with each other. Today, the resistance for bulls is found at 1.0611, while the bearish pressure is limited by the support at 1.0442 of the short-term trend.

H4 – H1
While trading in a narrow range on higher time frames, the pair is testing the key levels on the lower ones. Today, these levels are located at 1.0518 (weekly long-term trend) and 1.0543 (daily pivot point). A further move below this area will intensify the selling pressure. The intraday support levels are found at the standard pivot levels of 1.0497 – 1.0457 – 1.0411. Consolidation above the key levels (1.0518-43) will strengthen the bullish bias. The upper targets for the day are the levels of 1.0583 – 1.0629 –1.0669 (standard pivot levels).
***
GBP/USD
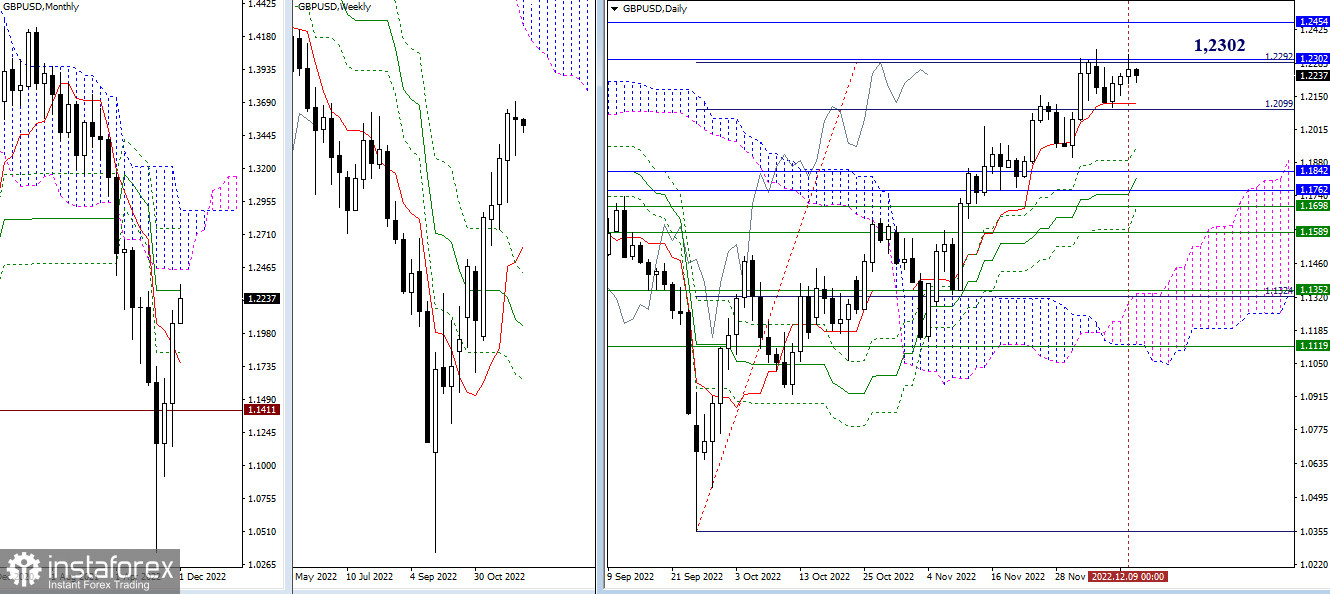
Higher time frames
The pound bulls keep testing the key levels of 1.2292 – 1.2302 (a fully tested daily target + monthly medium-term trend). So far, the buyers have failed to overcome the resistance area. However, the sellers have also failed to develop a rebound from the nearest resistance. So, the further direction of the pair will be determined after testing the area of 1.2292 – 1.2302. The next resistance level is found at 1.2454 (lower boundary of the monthly Ichimoku Cloud), while the nearest support is seen at 1.2121 – 1.2099 (daily short-term trend + first daily target).
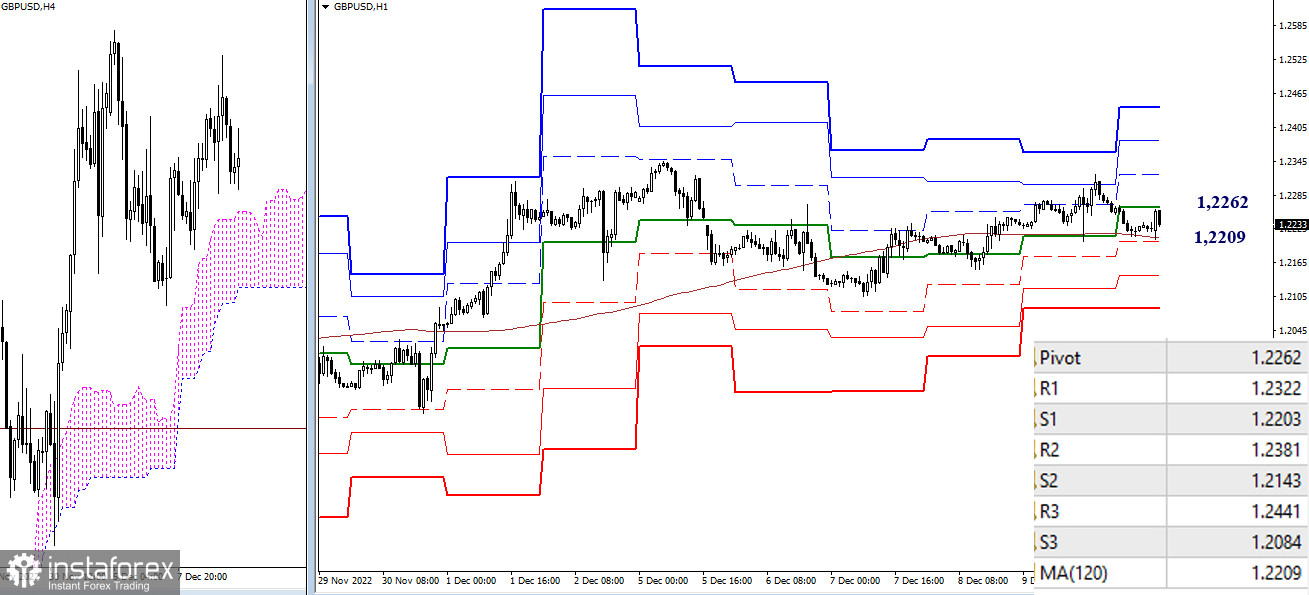
H4 – H1
On lower time frames, the pair is trading near the key levels located at 1.2262 – 1.2209 (central pivot level + weekly long-term trend). Trading close to the key levels creates market uncertainty. A move beyond the above-mentioned area will indicate the strength of either bulls or bears. Additional intraday targets are found at 1.2322 – 1.2381 – 1.2441 (resistance of standard pivot levels) and 1.2143 – 1.2084 (support of standard pivot levels).
***
Technical analysis is based on:
Higher time frames – Ichimoku Kinko Hyo (9.26.52) + Fibo Kijun levels
H1 – Pivot Points (standard) + 120-day Moving Average (weekly long-term trend)
*บทวิเคราะห์ในตลาดที่มีการโพสต์ตรงนี้ เพียงเพื่อทำให้คุณทราบถึงข้อมูล ไม่ได้เป็นการเจาะจงถึงขั้นตอนให้คุณทำการซื้อขายตาม
บทวิเคราะห์ของทาง InstaSpot จะทำให้คุณทราบถึงแนวโน้มของตลาด! ในการที่เป็นลูกค้าของทาง InstaSpot นั้นคุณจะได้รับการบริการเพื่อการซื้อขายอย่างเต็มประสิทธิภาพอย่างมากมาย


