


ตำนานแห่งทีม InstaSpot!
ที่สุด! คุณคิดว่าอะไรคือการทำให้รู้สึกฮึกเหิมกันละ? แต่พวกเราควรจะเรียกคนที่กลายมาเป็นชาวเอเชียคนแรกที่คว้าแชมป์หมากรุกระดับโลกรุ่นเยาวชนอายุ 18 ปี และยังกลายมาเป็นแกรนด์มาสเตอร์ชาวอินเดียคนแรกด้วยอายุ 19ปีเท่านั้น? นั้นเป็นจุดเริ่มต้นของเส้นทางสู่การเป็นแชมป์โลกสำหรับคุณ Viswanathan Anand คนที่กลายมาเป็นส่วนหนึ่งในหน้าประวติศาสตร์หมากรุกไปตลาดกาล ตอนนี้ก็มีอีกตำนานมาอยู่ในทีม InstaSpot แล้ว!


Borussia เป็นหนึ่งในสโมสรฟุตบอลขึ้นชื่อในประเทศเยอรมนี ที่ได้พิสูจน์ให้กับเหล่าแฟนๆเห็นแล้วถึงจิตวิญญาณของการแข่งขัน และการขึ้นมาสู่จุดสูงสุด เพื่อจะมุ่งหน้าสู่ความสำเร็จ การเทรดเองก็เหมือนกับการเล่นกีฬาอย่างมืออาชีพในการแข่งขัน โดยต้องมีความมั่นใจและการไม่หยุดนิ่ง เพื่อที่จะได้ "ผ่าน" จากสโมสร Borussia FC และขึ้นมาอยู่ในอันดับต้นไปพร้อมกับ InstaSpot!

The price of gold crashed after retesting the near-term resistance levels. It's trading at 1,906 at the time of writing far below 1,930 yesterday's high. After its massive drop, we cannot exclude a temporary rebound as the rate could test and retest the near-term resistance levels before resuming its drop.
A sell-off was natural after the US CB Consumer Confidence came in better than expected and after Canadian CPI and Core CPI reported lower inflation. Today, the Australian CPI reported a lower inflation as well, while the US Goods Trade Balance came in better than expected. Tomorrow, the US Final GDP, Unemployment Claims, and Fed Chair Powell Speaks should move the price.
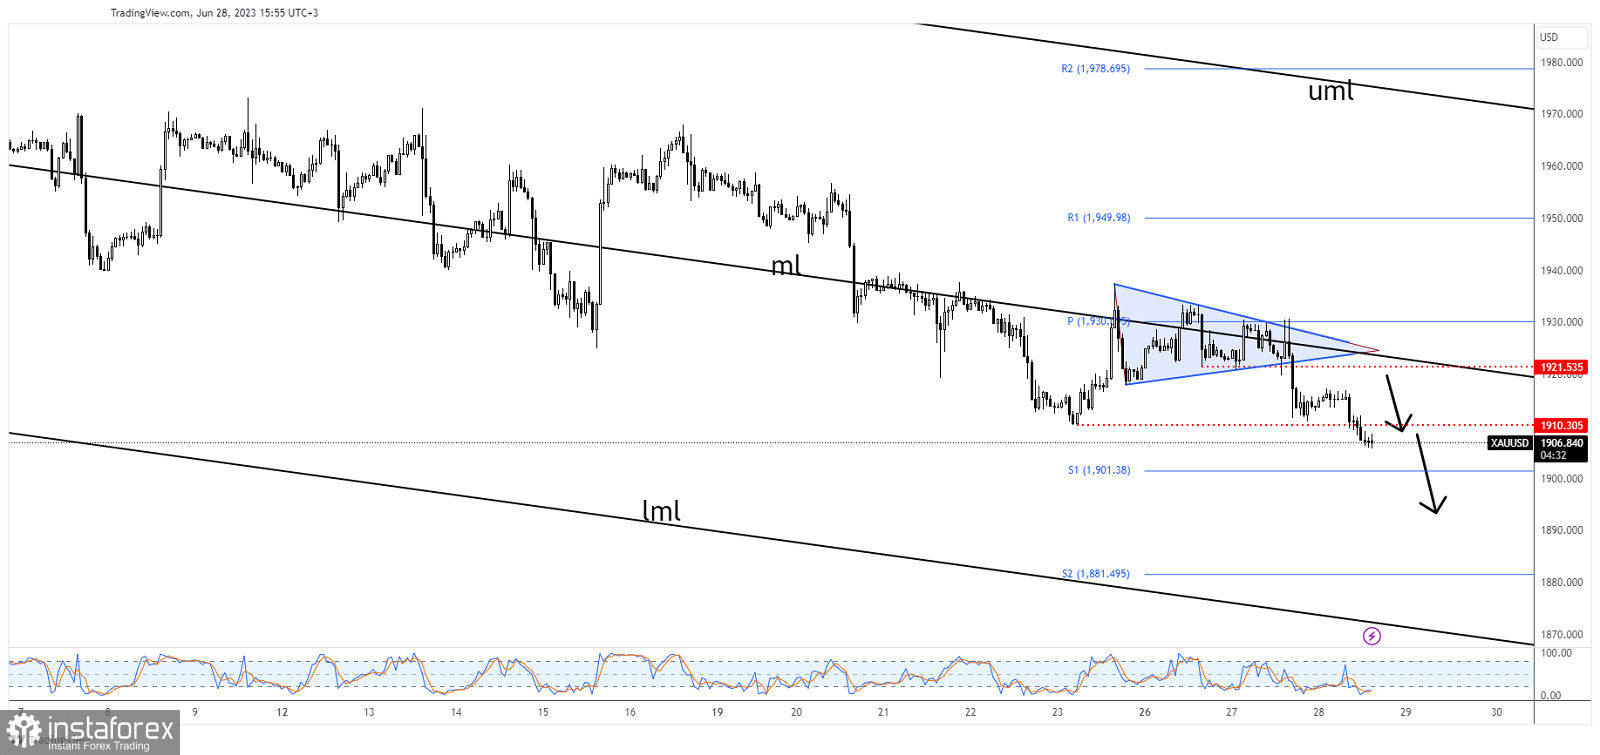
As you can see on the H1 chart, XAU/SUD registered only false breakouts above the weekly pivot point of 1,930 and through the triangle announcing a new sell-off. I told you yesterday that escaping from the triangle pattern should bring us new opportunities.
Its failure to stay above the median line (ml) of the descending pitchfork confirmed strong selling pressure. Now, it has dropped below the 1,910 former low signaling more declines.
Validating the breakdown below 1,910 activates a larger drop. A bearish closure below the S1 (1,901) opens the door for more declines and is seen as a new selling signal. The S2 (1,881) and the lower median line (lml) represent a potential target.
*บทวิเคราะห์ในตลาดที่มีการโพสต์ตรงนี้ เพียงเพื่อทำให้คุณทราบถึงข้อมูล ไม่ได้เป็นการเจาะจงถึงขั้นตอนให้คุณทำการซื้อขายตาม
บทวิเคราะห์ของทาง InstaSpot จะทำให้คุณทราบถึงแนวโน้มของตลาด! ในการที่เป็นลูกค้าของทาง InstaSpot นั้นคุณจะได้รับการบริการเพื่อการซื้อขายอย่างเต็มประสิทธิภาพอย่างมากมาย


