


Naš tim čini više od 7.000.000 trgovaca!
Svakog dana zajedno radimo na unapređenju trgovanja. Ostvarujemo vrhunske rezultate i krećemo se samo napred.
Priznatost od strane miliona trgovaca širom sveta najbolje pokazuje koliko se naš rad ceni! Napravili ste svoj izbor i mi ćemo učiniti sve što je neophodno da zadovoljimo vaša očekivanja!
Zajedno činimo sjajan tim!
InstaSpot. Sa ponosom radi za Vas!


Glumac, šampion UFC turnira i pravi heroj!
Čovek koji je ostvario sebe. Čovek koji hoda uz nas.
Tajna uspeha Taktarova jeste stalno kretanje ka svom cilju.
Otkrijte sve strane svog talenta!
Istražuj, pokušaj, padni - ali se nikad ne zaustavljaj!
InstaSpot. Priča Vašeg uspeha započinje ovde!

The EUR/USD currency pair traded lower again on Wednesday. The conflict in the Middle East has only just begun to fade due to Trump's verbal rhetoric; however, the objective reality indicates that Trump is very far from it. Yesterday, Iranian officials stated that the war would end when Tehran deems it necessary, threatened to destroy the U.S., reported on three damaged tankers attempting to pass through the Strait of Hormuz, and called for preparations for oil prices around $200 per barrel. Partly, Iran can be understood. Israel, the U.S., and other coalition allies have inflicted serious damage, so it would be naive to think Tehran would simply surrender. Unfortunately, the conflict could drag on for months or even years, dealing an irreparable blow to the global economy. Meanwhile, the dollar is gaining strength again as markets flee from risks.
From a technical perspective, the downward trend has not yet transformed into an upward one. The Senkou Span B line has not been breached, and even the 1.1657-1.1666 area did not allow the euro to push higher. Thus, if geopolitics remains this tense, the dollar could continue its rise, which would contradict the technical picture, the fundamental scenario, and the macroeconomic outlook. In other words, geopolitics currently takes precedence over everything.
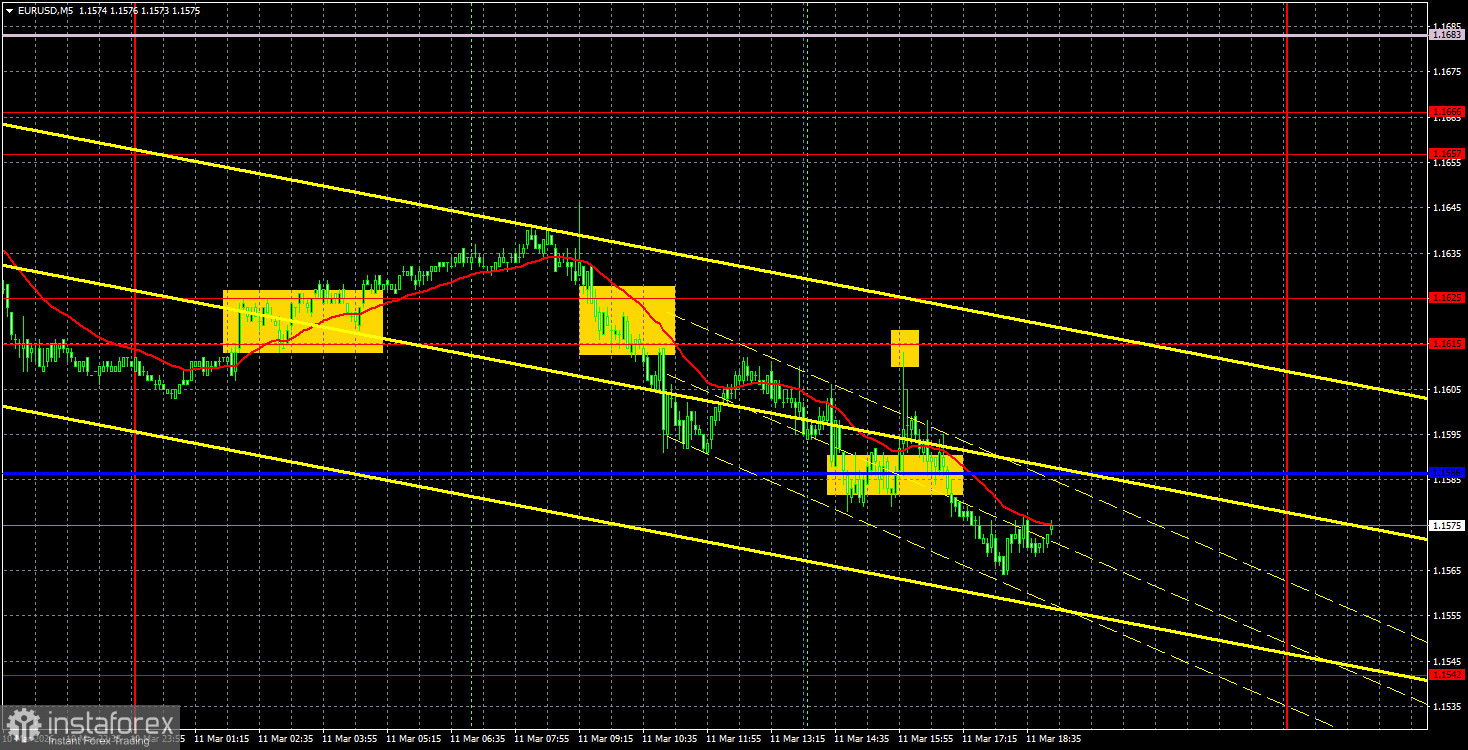
On the 5-minute timeframe, several trading signals were generated yesterday. During the U.S. trading session, the inflation report was released, causing confusion among traders. Inflation remained unchanged, but the dollar temporarily declined across the market. It dipped only to return to its upward trajectory. Thus, of the four trading signals, only three could provide traders with a profit, making it difficult to capitalize on movements throughout the day.
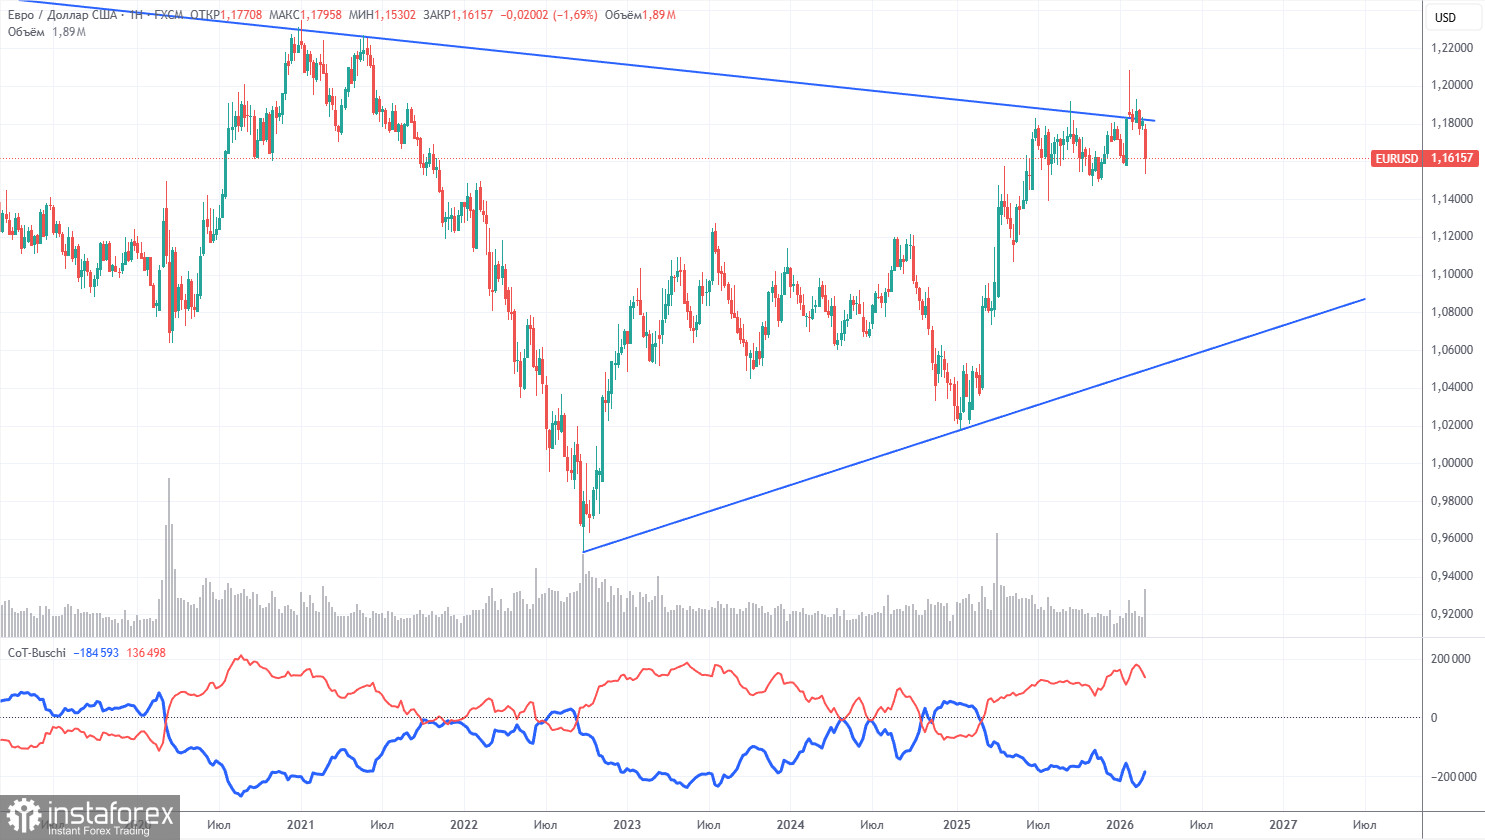
The latest COT report is dated March 3. The illustration on the weekly timeframe clearly shows that the net position of non-commercial traders remains "bullish," and since Trump took office for a second time, the dollar has only been falling. We cannot say that the decline of the U.S. currency will continue with 100% probability, but current developments around the world suggest this is a possibility.
We still see no fundamental factors that would strengthen the European currency, even amid the war in the Middle East. However, there are plenty of factors supporting the decline of the American dollar. The global downward trend still holds, but how important is it now, given where the price has moved over the last 18 years? Since September 2022, a new upward trend has been forming, breaking through the global downward trend line. Thus, the path further upward is open.
The positioning of the red and blue lines of the indicator continues to indicate the maintenance of a "bullish" trend. During the last reporting week, the number of longs for the "Non-commercial" group decreased by 300, while the number of shorts increased by 20,000. Consequently, the net position decreased by 20,300 contracts over the week.
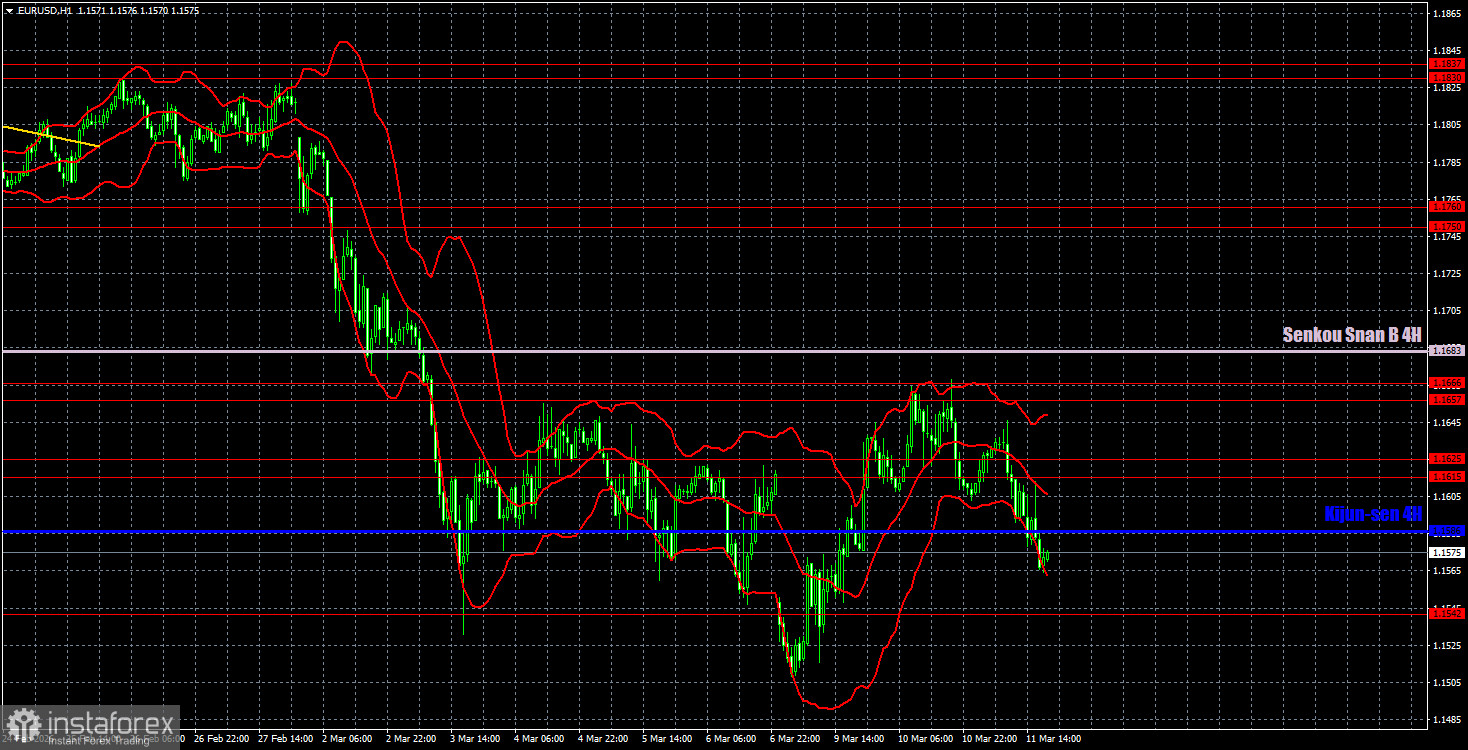
On the hourly timeframe, the EUR/USD pair continues its downward trend amid geopolitical events in the Middle East. The situation in the Middle East gave traders hope for only two days, but has now reverted to the reality of war and mutual threats. The dollar has not yet updated its annual highs, but with the current developments, it may do so in the near future.
For March 12, we highlight the following trading levels: 1.1362, 1.1426, 1.1542, 1.1615-1.1625, 1.1657-1.1666, 1.1750-1.1760, 1.1830-1.1837, 1.1907-1.1922, 1.1971-1.1988, as well as the Senkou Span B line (1.1683) and the Kijun-sen line (1.1586). The lines of the Ichimoku indicator may shift during the day, which should be considered when determining trading signals. Don't forget to set a Stop Loss at breakeven if the price moves in the correct direction by 15 pips. This will protect against potential losses if the signal proves to be false.
On Thursday, there are no significant reports or events scheduled in the European Union or the U.S., and the market has recently been largely ignoring macroeconomic data. Thus, movements in the pair today will once again depend on geopolitics.
On Thursday, traders may consider short positions if the price consolidates below 1.1542, targeting 1.1426. Long positions can be considered if there is a rebound from the level of 1.1542, with targets at 1.1615-1.1625 and 1.1657-1.1666.
*Analiza tržišta koja se ovde nalazi namenjena je boljem razumevanju tržišta i ne pruža instrukcije za vršenje trgovanja.
Uz InstaSpot-ove analitičke preglede uvek ćete biti u toku sa tržišnim trendovima! Klijentima InstaSpot-a su dostupni mnogobrojni besplatni servisi za uspešno trgovanje.


