


Naš tim čini više od 7.000.000 trgovaca!
Svakog dana zajedno radimo na unapređenju trgovanja. Ostvarujemo vrhunske rezultate i krećemo se samo napred.
Priznatost od strane miliona trgovaca širom sveta najbolje pokazuje koliko se naš rad ceni! Napravili ste svoj izbor i mi ćemo učiniti sve što je neophodno da zadovoljimo vaša očekivanja!
Zajedno činimo sjajan tim!
InstaSpot. Sa ponosom radi za Vas!


Glumac, šampion UFC turnira i pravi heroj!
Čovek koji je ostvario sebe. Čovek koji hoda uz nas.
Tajna uspeha Taktarova jeste stalno kretanje ka svom cilju.
Otkrijte sve strane svog talenta!
Istražuj, pokušaj, padni - ali se nikad ne zaustavljaj!
InstaSpot. Priča Vašeg uspeha započinje ovde!

The EUR/USD currency pair finally began to correct on Wednesday, with the market halting its dollar purchases based solely on geopolitical factors. However, after Wednesday, it can be said that it would have been better if the collapse had continued. The character of the pair's movement yesterday was such that one felt like closing the charts and focusing on other matters. The price constantly changed direction, and traders ignored macroeconomic data, which continue to impress with their positivity. In the US yesterday, two reports were published that are conditionally important. The ADP report, now regarded with little trust, showed a higher-than-expected figure, but it did not help the dollar. The ISM Services PMI rose to 56.1 points, marking the highest level since August 2022. However, this report also did not lead to an increase in the value of the American currency.
On one hand, this makes sense. The dollar had risen for at least two days, so a correction is due. On the other hand, we see once again that the macroeconomic background is being ignored. Currently, the most important question is whether the market has finished factoring in the war in the Middle East. Clearly, this factor will not consistently support the dollar, but events are unfolding so rapidly and destructively that we may still see a few dollar impulses. The market remains highly agitated, so calm, stable movements are unlikely at this time.
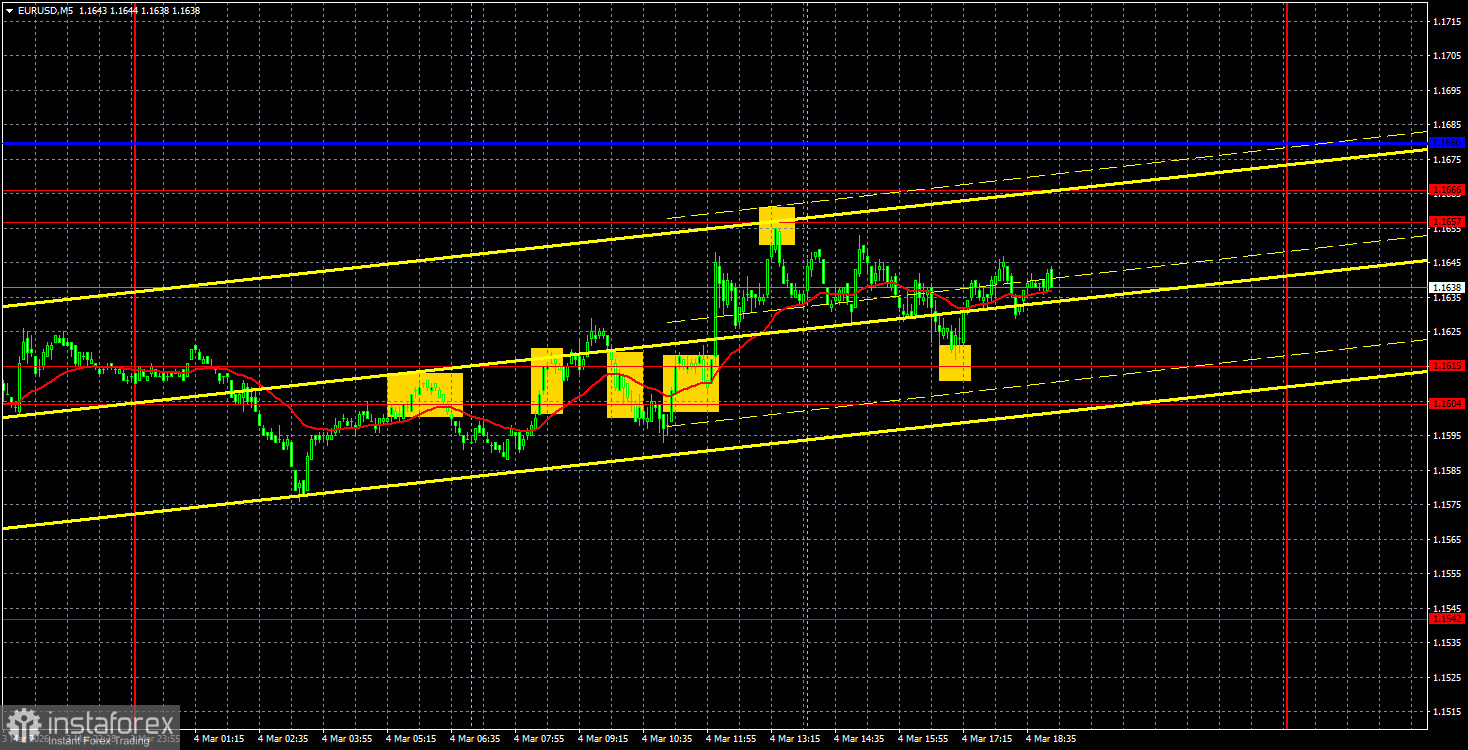
The pair's movement on the 5-minute timeframe on Wednesday illustrates this well. Essentially, across any level or area, traders would hardly have managed to profit from such movements. During the American trading session, two precise signals were formed—around the levels of 1.1657 and 1.1615. These allowed traders to make some profits after a lackluster European session.
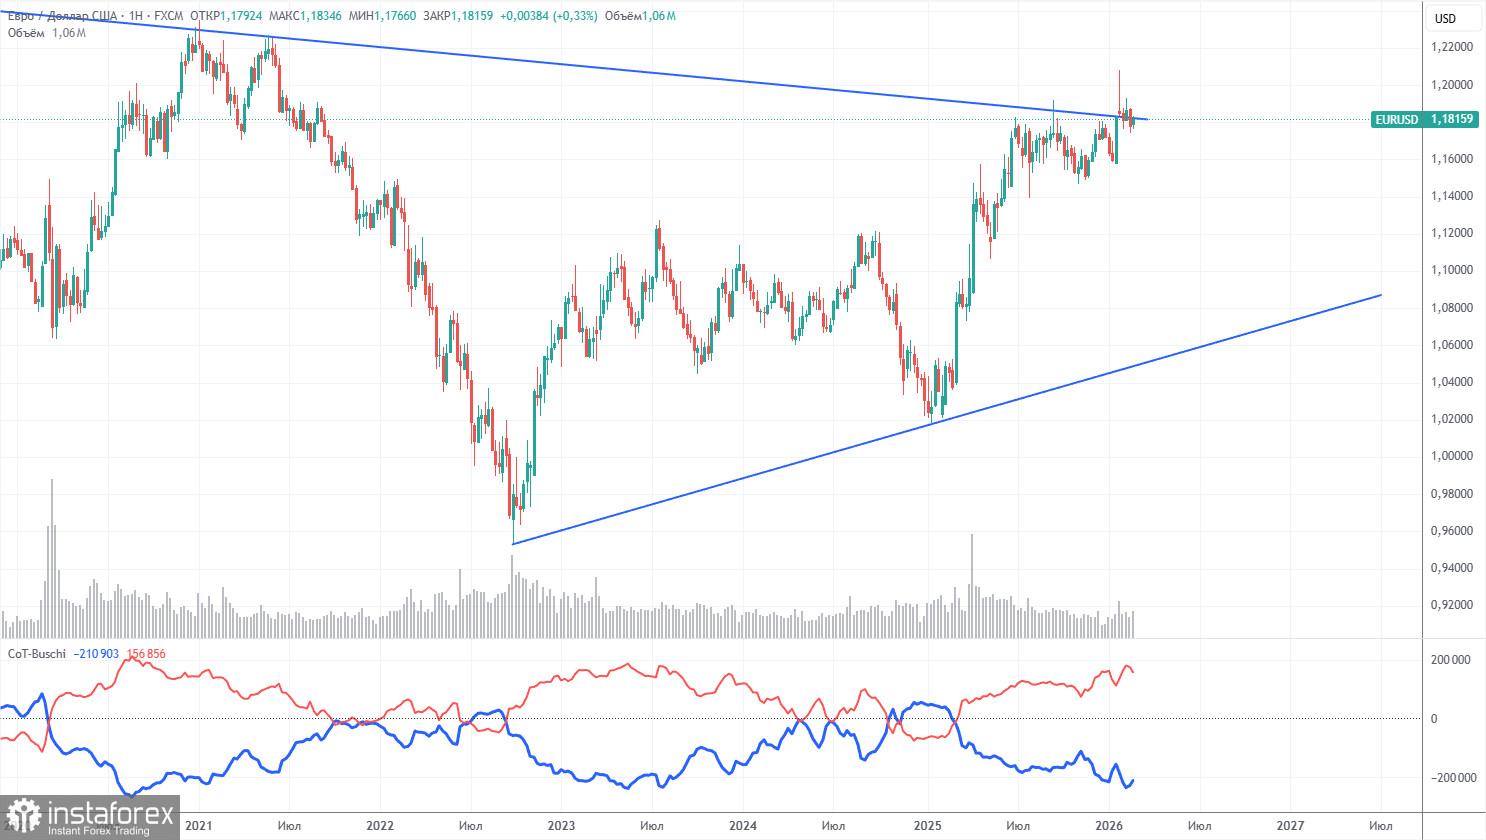
The latest COT report is dated February 24. The weekly timeframe illustration clearly shows that the net position of non-commercial traders remains "bullish," and since Trump took office as President of the US for the second time, only the dollar has been falling. We cannot claim that the decline of the American currency will continue with 100% certainty, but current developments around the world suggest this is likely.
We still do not see any fundamental factors that would strengthen the European currency, while there remain sufficient factors for the decline of the American one. The global downward trend is still in place, but what significance does it have for where the price has moved over the last 18 years? A new upward trend has been forming since September 2022, breaking the global downward trend line. Therefore, the path further north is open.
The positioning of the red and blue lines of the indicator continues to indicate the retention of a "bullish" trend. Over the last reporting week, the number of longs among the "Non-commercial" group decreased by 16,700, while the number of shorts increased by 900. Consequently, the net position decreased by 15,800 contracts over the week.
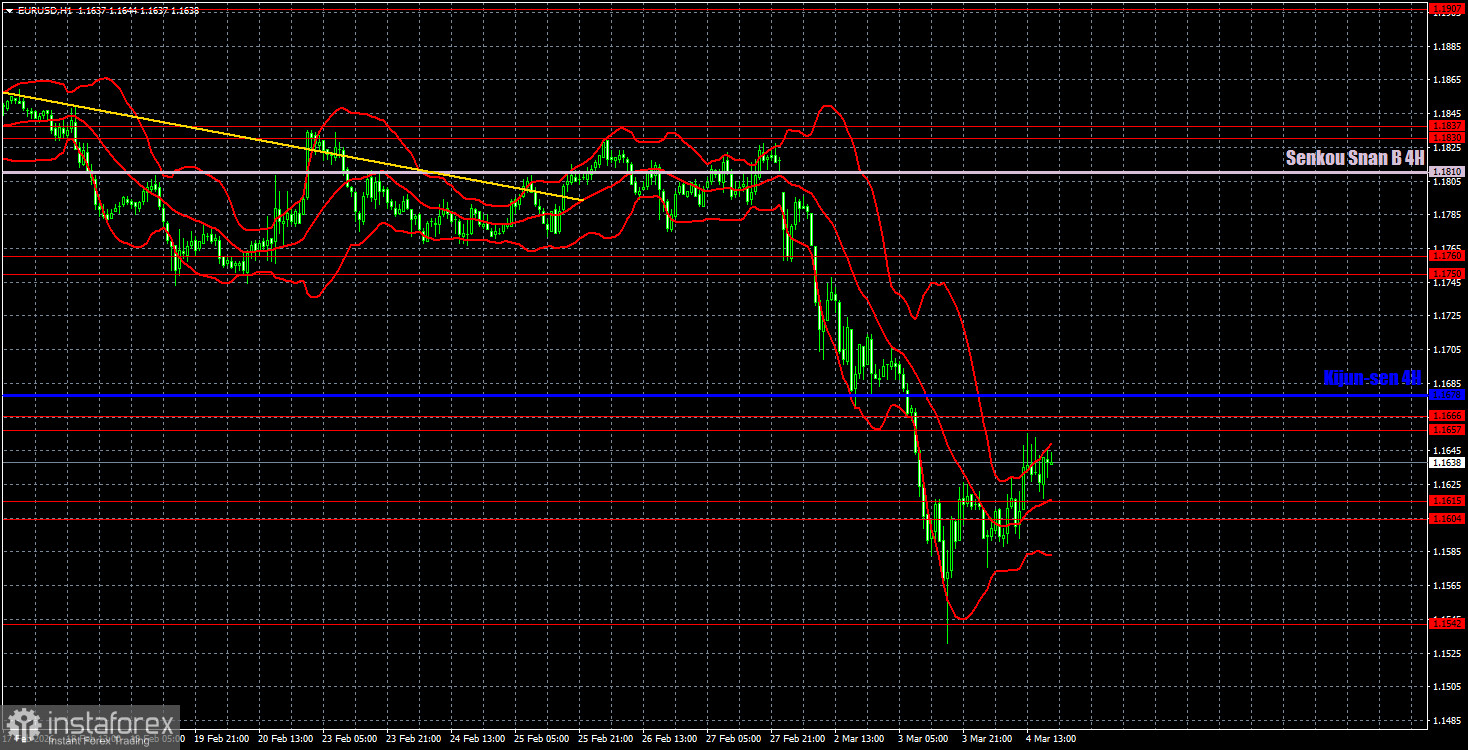
On the hourly timeframe, the EUR/USD pair continues to display a new downward trend amid the geopolitical events in the Middle East. It remains unclear how long the dollar's strength will persist solely on this factor, as it will depend on the intensity and duration of the war, losses on both sides, and the US's ability to achieve its objectives. However, we again have a downward trend at this time.
For March 5, we highlight the following trading levels — 1.1362, 1.1426, 1.1542, 1.1604-1.1615, 1.1657-1.1666, 1.1750-1.1760, 1.1830-1.1837, 1.1907-1.1922, 1.1971-1.1988, as well as the Senkou Span B line (1.1810) and Kijun-sen (1.1678). The Ichimoku indicator lines may shift during the day, which should be taken into account when determining trading signals. Remember to set the Stop Loss order to breakeven if the price moves in the correct direction by 15 pips. This will protect against potential losses if the signal turns out to be false.
On Thursday, a report on retail sales is scheduled for release in the Eurozone, while in the US, a report on unemployment claims will be published. Both reports are secondary, and we do not anticipate a significant market reaction to them. Today, everything will again depend on geopolitics, market sentiment, and technical factors.
On Thursday, traders may consider selling with targets at 1.1542 and 1.1426 if the pair consolidates below the 1.1604-1.1615 area. Long positions can be considered with targets of 1.1657-1.1666 and the Kijun-sen line if there is a bounce from the area of 1.1604-1.1615.
*Analiza tržišta koja se ovde nalazi namenjena je boljem razumevanju tržišta i ne pruža instrukcije za vršenje trgovanja.
Uz InstaSpot-ove analitičke preglede uvek ćete biti u toku sa tržišnim trendovima! Klijentima InstaSpot-a su dostupni mnogobrojni besplatni servisi za uspešno trgovanje.


