


Naš tim čini više od 7.000.000 trgovaca!
Svakog dana zajedno radimo na unapređenju trgovanja. Ostvarujemo vrhunske rezultate i krećemo se samo napred.
Priznatost od strane miliona trgovaca širom sveta najbolje pokazuje koliko se naš rad ceni! Napravili ste svoj izbor i mi ćemo učiniti sve što je neophodno da zadovoljimo vaša očekivanja!
Zajedno činimo sjajan tim!
InstaSpot. Sa ponosom radi za Vas!


Glumac, šampion UFC turnira i pravi heroj!
Čovek koji je ostvario sebe. Čovek koji hoda uz nas.
Tajna uspeha Taktarova jeste stalno kretanje ka svom cilju.
Otkrijte sve strane svog talenta!
Istražuj, pokušaj, padni - ali se nikad ne zaustavljaj!
InstaSpot. Priča Vašeg uspeha započinje ovde!

The EUR/USD pair was caught in a whirlwind of events on Tuesday. The day before, we warned of the impending rise in volatility, as a large number of macroeconomic events were scheduled. Due to this significant volume of reports, we also cautioned that the pair might change direction multiple times throughout the day. This turned out to be accurate. The pair initially rose sharply before returning to its previous levels. Almost all reports, except for the US Non-Farm Payrolls and the unemployment rate, were ignored by the market. The NFP and unemployment reports left a mixed aftertaste.
The unemployment rate is straightforward. The unexpected rise to 4.6% is certainly not a positive development for the American economy. The situation with the Non-Farm Payrolls is more complex. The October figure fell drastically, but September was revised upwards, and November exceeded forecasts. Yes, the number of new jobs created is still too low, but at least it's positive for November. Consequently, one could consider the November report as positive for the dollar. However, the unemployment report overshadowed that.
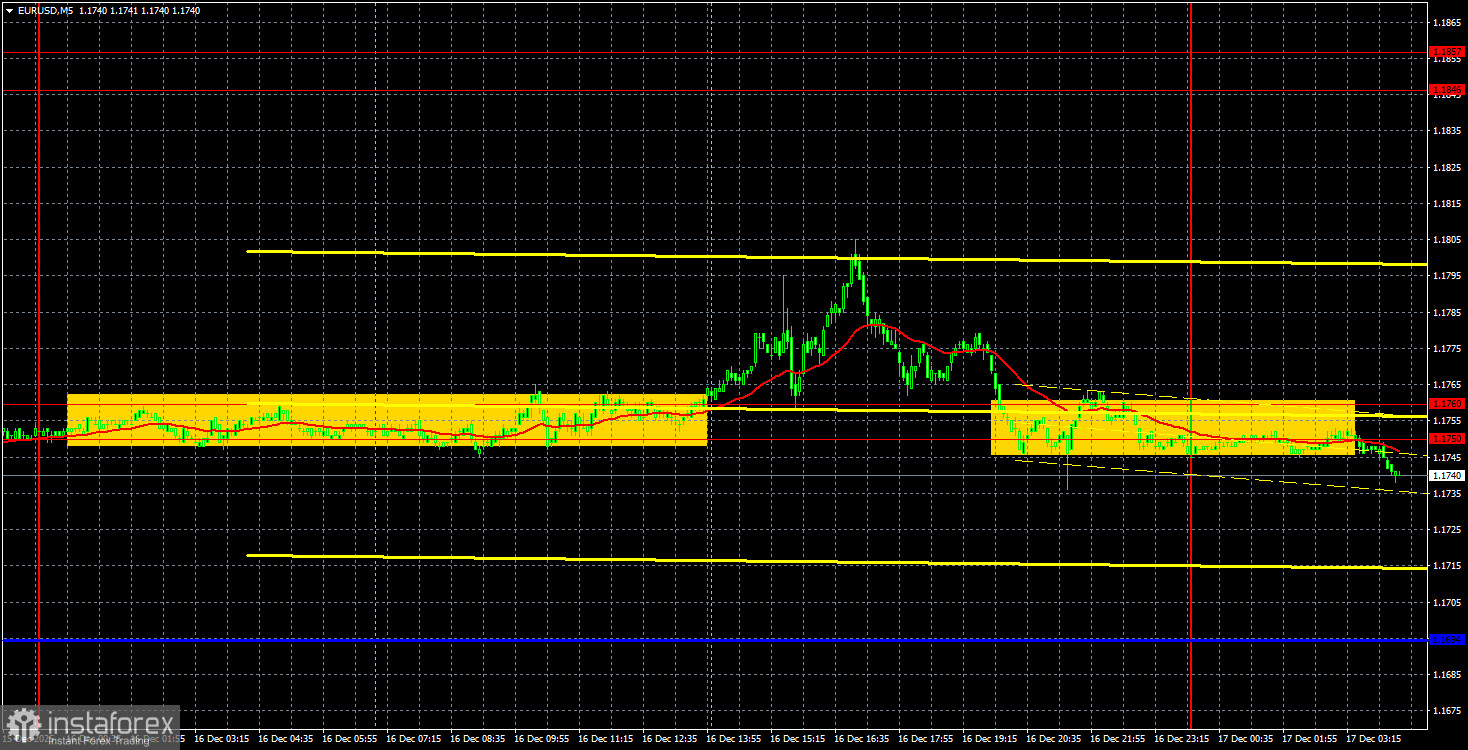
On the 5-minute timeframe, traders could have opened long positions after the price broke out of the 1.1750-1.1760 range, but managing this trade amidst the NFP and unemployment reports was very challenging. The trade could have been manually closed with a profit, but the upper line of the daily channel was also tested, and a rebound from it could trigger a drop back to previous levels.
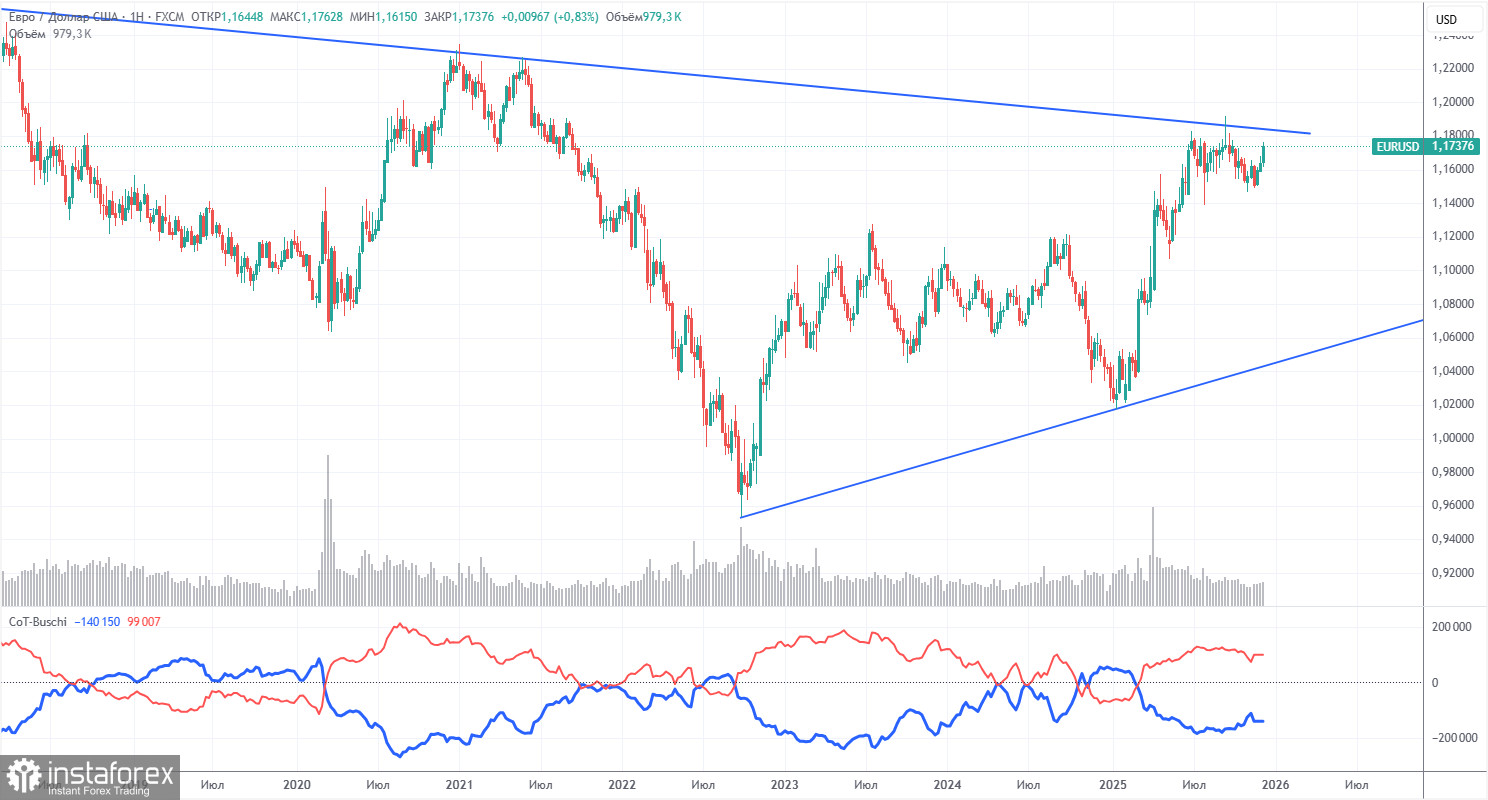
The latest COT report was released last week and is dated November 18. Thus, it is still outdated. The illustration above clearly shows that the net position of non-commercial traders has long been "bullish," with bears struggling to regain their superiority in late 2024, only to quickly lose it again. Since Trump assumed the presidency for the second time, the dollar has been falling. We cannot say with 100% certainty that the decline of the US currency will continue, but current global developments suggest this is a possibility.
We still do not see any fundamental factors that would strengthen the euro; however, there are sufficient factors for the decline of the US dollar. The global downward trend continues, but what significance does it hold regarding price movements over the last 17 years? The dollar may begin to rise if the global fundamental picture changes, but there are currently no signs of that.
The positioning of the red and blue lines on the indicator continues to indicate the preservation of the "bullish" trend. During the last reporting week, the number of long positions in the "Non-commercial" group increased by 8,000, while the number of shorts decreased by 17,400. Consequently, the net position increased by 25,400 contracts during the week. However, this data remains outdated and holds no significance.
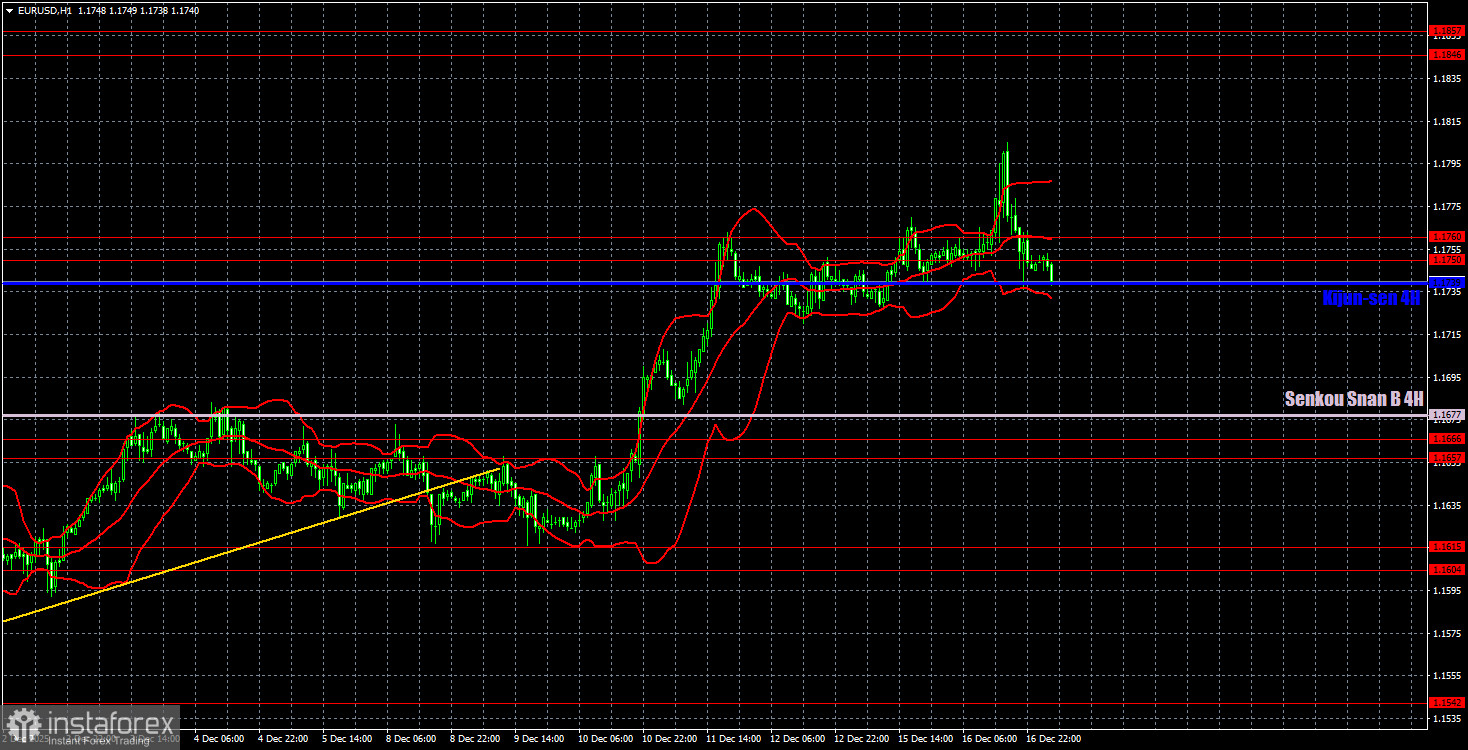
On the hourly timeframe, the EUR/USD pair continues its upward movement, which fully aligns with our expectations. However, the upper channel line at 1.1400-1.1830 was tested yesterday, suggesting we may now be witnessing a technical decline, as the flat continuation persists on the daily timeframe. Essentially, we observed a reversal near the upper boundary of the channel, suggesting a decline towards the lower bound is plausible.
For December 17, we highlight the following levels for trading: 1.1234, 1.1274, 1.1362, 1.1426, 1.1542, 1.1604-1.1615, 1.1657-1.1666, 1.1750-1.1760, 1.1846-1.1857, 1.1922, 1.1971-1.1988, and also the Senkou Span B line (1.1677) and Kijun-sen (1.1739). The Ichimoku indicator lines may move throughout the day, which should be taken into account when determining trading signals. Don't forget to set a Stop Loss order to breakeven if the price moves in the correct direction by 15 pips. This will protect against potential losses if the signal turns out to be false.
On Wednesday, two reports are scheduled in the Eurozone, while none are scheduled in the US. In Germany, a secondary business climate index will be released, and in the EU, a second estimate of November inflation will be released, which is not particularly relevant. Therefore, volatility may remain low again today.
On Wednesday, traders may trade from the area of 1.1739-1.1760 (along with the Kijun-sen line). A price settlement below this area will make short positions relevant, targeting the Senkou Span B line. A rebound from this area will lead to another attempt to break out of the 1.1400-1.1830 range.
*Analiza tržišta koja se ovde nalazi namenjena je boljem razumevanju tržišta i ne pruža instrukcije za vršenje trgovanja.
Uz InstaSpot-ove analitičke preglede uvek ćete biti u toku sa tržišnim trendovima! Klijentima InstaSpot-a su dostupni mnogobrojni besplatni servisi za uspešno trgovanje.


