


Naš tim čini više od 7.000.000 trgovaca!
Svakog dana zajedno radimo na unapređenju trgovanja. Ostvarujemo vrhunske rezultate i krećemo se samo napred.
Priznatost od strane miliona trgovaca širom sveta najbolje pokazuje koliko se naš rad ceni! Napravili ste svoj izbor i mi ćemo učiniti sve što je neophodno da zadovoljimo vaša očekivanja!
Zajedno činimo sjajan tim!
InstaSpot. Sa ponosom radi za Vas!


Glumac, šampion UFC turnira i pravi heroj!
Čovek koji je ostvario sebe. Čovek koji hoda uz nas.
Tajna uspeha Taktarova jeste stalno kretanje ka svom cilju.
Otkrijte sve strane svog talenta!
Istražuj, pokušaj, padni - ali se nikad ne zaustavljaj!
InstaSpot. Priča Vašeg uspeha započinje ovde!

Trend analysis:
GBP/USD may start moving upward in April, rising from the closing of the March monthly candle at 1.2622 to the historical resistance level of 1.2848 (blue dashed line). After that, it will climb toward the upper fractal located at 1.3139 (yellow dashed line).
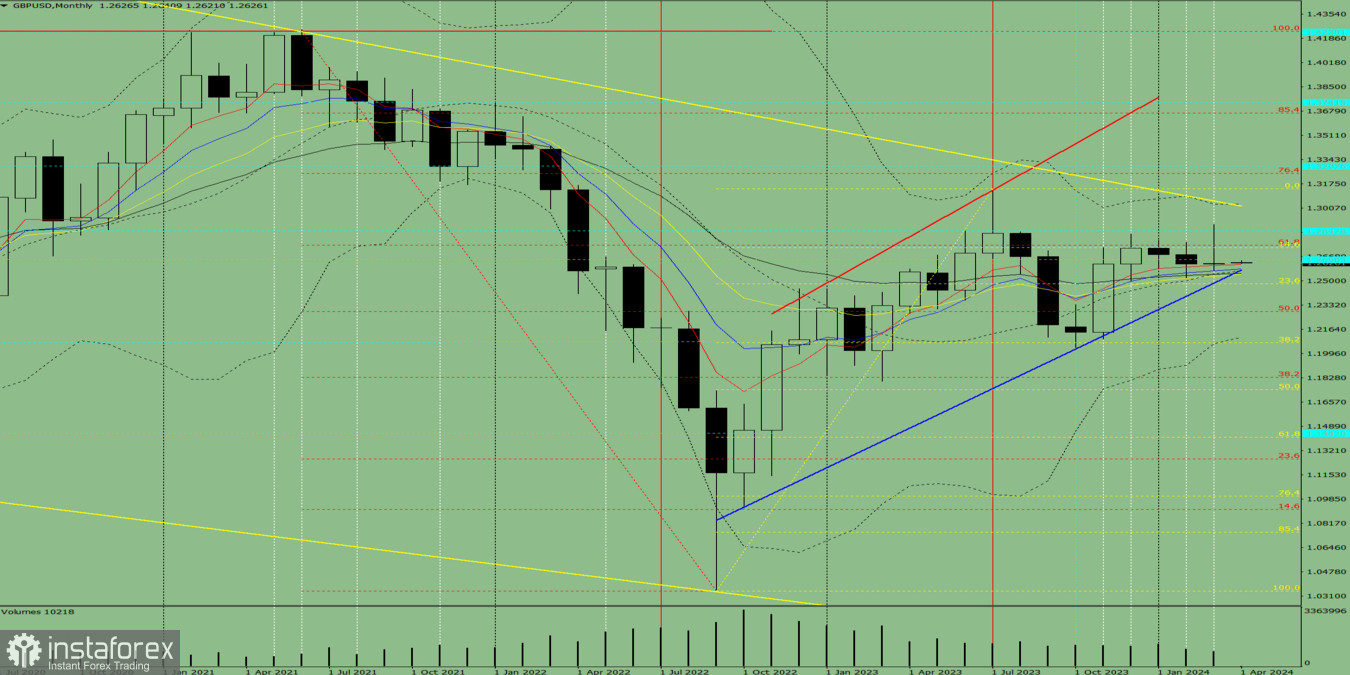
Fig. 1 (monthly chart)
Comprehensive analysis:
Indicator analysis - uptrend
Fibonacci levels - uptrend
Volumes - uptrend
Candlestick analysis - uptrend
Trend analysis - uptrend
Bollinger bands - uptrend
Conclusion: All signals point to an upward movement in GBP/USD.
Overall conclusion: The pair will have a bullish trend, with no first lower shadow on the monthly white candle (first week of month - white) and a second upper shadow (last week of the month - black).
Therefore, for this month, pound will rise from 1.2622 (closing of the March monthly candle) to the historical resistance level of 1.2848 (blue dashed line), and then approach the upper fractal located at 1.3139 (yellow dashed line).
Alternatively, it could go up from 1.2622 (closing of the March monthly candle) to the upper fractal located at 1.2892 (monthly candle from March 2024), followed by a decline to the 14.6% retracement level of 1.2730 (yellow dashed line).
*Analiza tržišta koja se ovde nalazi namenjena je boljem razumevanju tržišta i ne pruža instrukcije za vršenje trgovanja.
Uz InstaSpot-ove analitičke preglede uvek ćete biti u toku sa tržišnim trendovima! Klijentima InstaSpot-a su dostupni mnogobrojni besplatni servisi za uspešno trgovanje.


