



Nossa equipe tem mais de 7,000,000 traders!
Todos os dias, trabalhamos juntos para melhorar a negociação. Obtivemos resultados elevados e avançamos.
O reconhecimento de milhões de traders em todo o mundo é a melhor apreciação do nosso trabalho! Você nos escolheu e faremos tudo o que for necessário para atender às suas expectativas!
Nós somos uma ótima equipe juntos!
InstaSpot. Orgulho de trabalhar para você!



Ator, hexacampeão do UFC e um verdadeiro herói!
Um homem de sucesso. Um homem que mostra o nosso caminho.
O segredo por trás do sucesso de Taktarov é um movimento constante em direção ao objetivo.
Revele todos os lados do seu talento!
Descubra, tente, falhe, mas nunca pare!
I InstaSpot. Sua história de sucesso começa aqui!
Bitcoin and Ether continue the correction they had been preparing for weeks. Recall that the last two major developments for the crypto world were more negative than positive. Central banks (notably the Fed) have begun tightening monetary policy, which raises demand for safe assets rather than Bitcoin. The Clarity Act remains only a bill. If Democrats win control of Congress, there is a real chance the bill will never become law. Thus, the fundamentals for further crypto market upside look questionable.
Meanwhile, experts have concluded that correlations between Bitcoin and equity indices and between Bitcoin and gold no longer hold. If Bitcoin were primarily a risk asset, a correlation with the US stock market—which rose strongly in 2026—would be logical. If it were a safe-haven asset, correlation with gold—which also rose much of 2026—would make sense. Instead, Bitcoin only began an uptrend at the end of summer, which, as we have repeatedly noted, so far appears to be just part of a broad sideways channel on the daily chart.
Analysts also point out that Bitcoin has been ascribed different roles in different periods, none of which withstood the test of time. A few years ago Bitcoin was touted as an inflation hedge, yet in 2022—when inflation spiked—it crashed from $69,000 to $16,000. It has not become a global payment system supplanting fiat or bank transfers, as 2026 clearly shows. Digital gold was meant to be a "quiet haven" for investors and traders, but how can Bitcoin be called a haven if it can lose 50% of its value within six months?
In our view, Bitcoin never had a true structural correlation with either equities or gold. Movements coincided in some periods, which led to conclusions about correlation, but in reality Bitcoin's nature differs from stocks and precious metals.
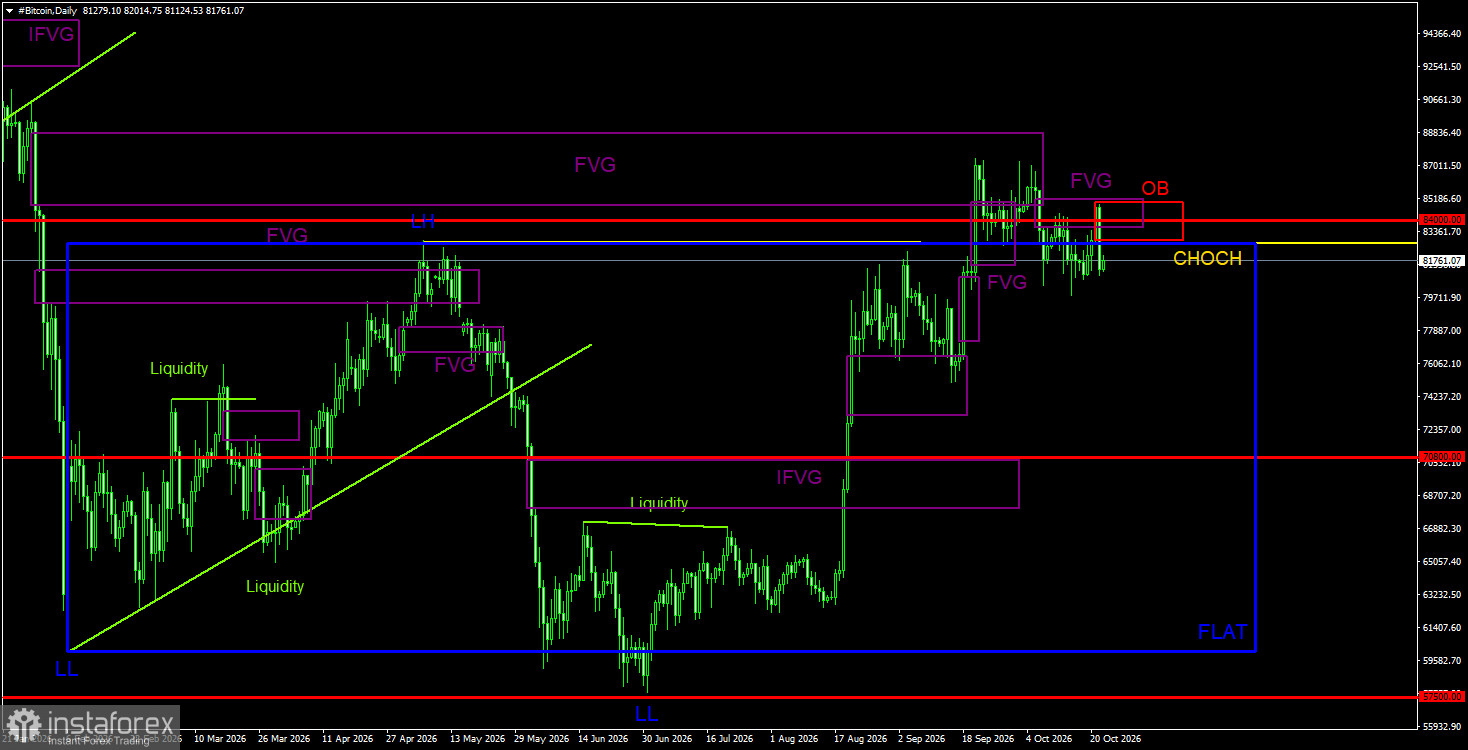
Trading recommendations for BTC/USD:
Bitcoin shows signs of a nascent bull trend. This trend began, as often happens, with a pump that lacks clear, concrete reasons. The Fed has not started cutting rates, and the Clarity Act was not adopted. In the near term on the daily timeframe, Bitcoin may be in decline: the price reacted to a bearish FVG and generated two sell signals. Also note that the breakout beyond the daily sideways channel could be a deviation—yes, a deep deviation, but still a deviation. If so, Bitcoin could head toward $70,800 and even preserve the downtrend that began last year. We consider short positions most relevant for the near term. On the daily timeframe two sell signals with deviation formed, and on the 4-hour timeframe a deviation has been created. Prospects for Bitcoin remain bearish. Near targets are $80,400 and $70,800. A deviation near the lower boundary of the 4-hour channel may keep Bitcoin in a flat for some time.
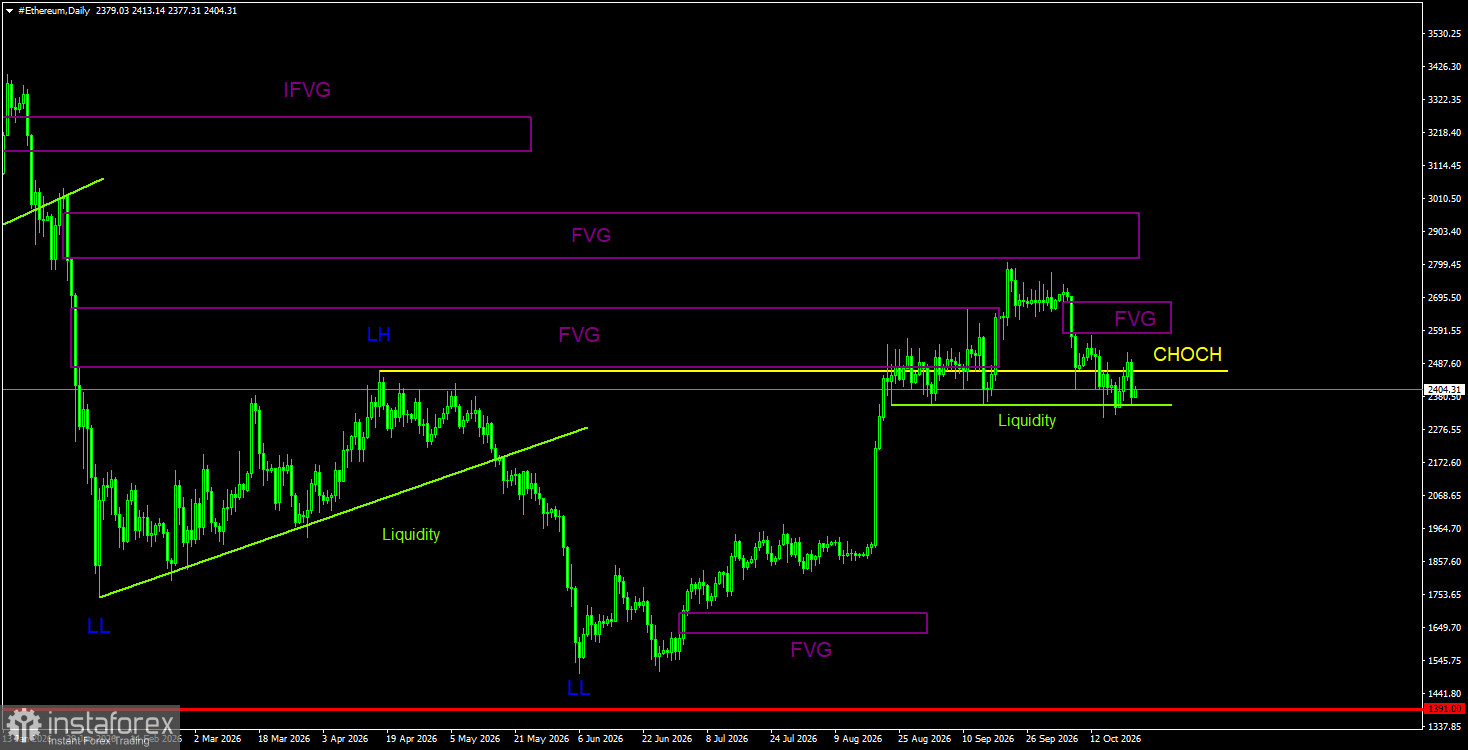
Trading recommendations for ETH/USD:
On the daily timeframe the technical picture for Ether has changed completely and now points to a new uptrend. However, bulls can rely only on the weekly chart, where Ether has targeted $4,800, the upper boundary of a five-year sideways channel. On the daily timeframe the first bearish FVG did not produce a meaningful price reaction, but Bitcoin reacted to its own FVGs, and recall Ether's price depends on Bitcoin by roughly 80–90%. Bitcoin began to correct, and Ether plunged as well. Thus, in the near term we expect declines. Ether targets are around $2,300 and lower, down to $1,850 and $1,391. On the daily timeframe, Ether received a sell signal from the nearest FVG. Given multiple sell signals on Bitcoin, Ether does not need its own signals to fall.
Explanations for the illustrations:
CHOCH—change of character, break of trend structure.
Liquidity—liquidity, stop losses, and pending orders that market makers use to build positions.
FVG—fair value gap, an area of price inefficiency. Price moves quickly through such areas, indicating the absence of one side in the market. Later prices tend to return and react to these areas in the direction of the main trend.
IFVG — inverted fair value gap. After a return to such an area, Price receives no reaction and impulsively breaks through, then tests from the other side.
OB — order block. The candle on which a market maker opened a position to capture liquidity and form a position in the opposite direction.
*A análise de mercado aqui postada destina-se a aumentar o seu conhecimento, mas não dar instruções para fazer uma negociação.
InstaSpot analytical reviews will make you fully aware of market trends! Being an InstaSpot client, you are provided with a large number of free services for efficient trading.


