


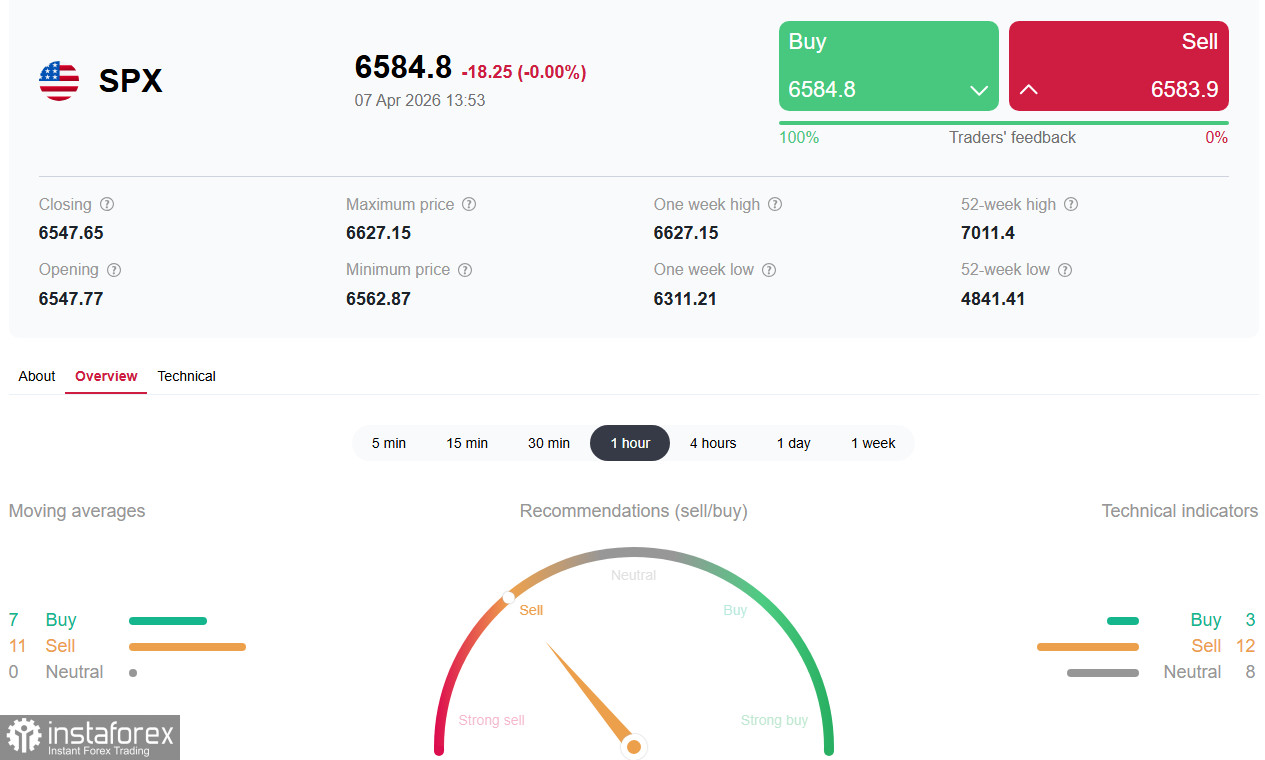
See also: InstaSpot trading indicators for S&P500 (SPX)
The US equity market is frozen in tension, as the "X hour" is set for 20:00 Eastern Time (24:00 GMT)—the deadline of President Donald Trump's ultimatum to Iran. Futures on the main US equity indices are down at the start of the US trading session, and investors prefer cash. We examine what is happening to Wall Street's flagship index and where it may be headed next.
Main driver: not Fed, but Tehran
Normally in April, attention focuses on corporate reports and signals from the Federal Reserve. However, today the dominant factor is geopolitics.
The situation is escalating. Iran has officially rejected a 45-day ceasefire, calling it merely an opportunity for the enemy to "regroup forces." Tehran demands a permanent cessation of hostilities, guarantees against renewed aggression, and, most sensitively for markets, recognition of Iranian sovereignty over the Strait of Hormuz.
The Islamic Revolutionary Guard Corps (IRGC) warned neighboring countries that "restraint is over," threatening strikes on US and partner infrastructure.
The market reaction was immediate:
- S&P 500 futures fell by 0.5%,
- Dow Jones futures dropped by 0.4%,
- Nasdaq 100 lost 0.6%.
Energy shock and Fed rate: dangerous cocktail
Brent oil prices have settled above $107 per barrel. This is no longer just a geopolitical premium but a full supply shock that changes the macroeconomic landscape.
Until recently, markets priced in Fed easing in H2. Now, those expectations are collapsing. According to the CME Group's FedWatch tool, the probability that the Fed will leave rates unchanged in April is 98.4% and 78% for December. The market no longer expects rate cuts this year.
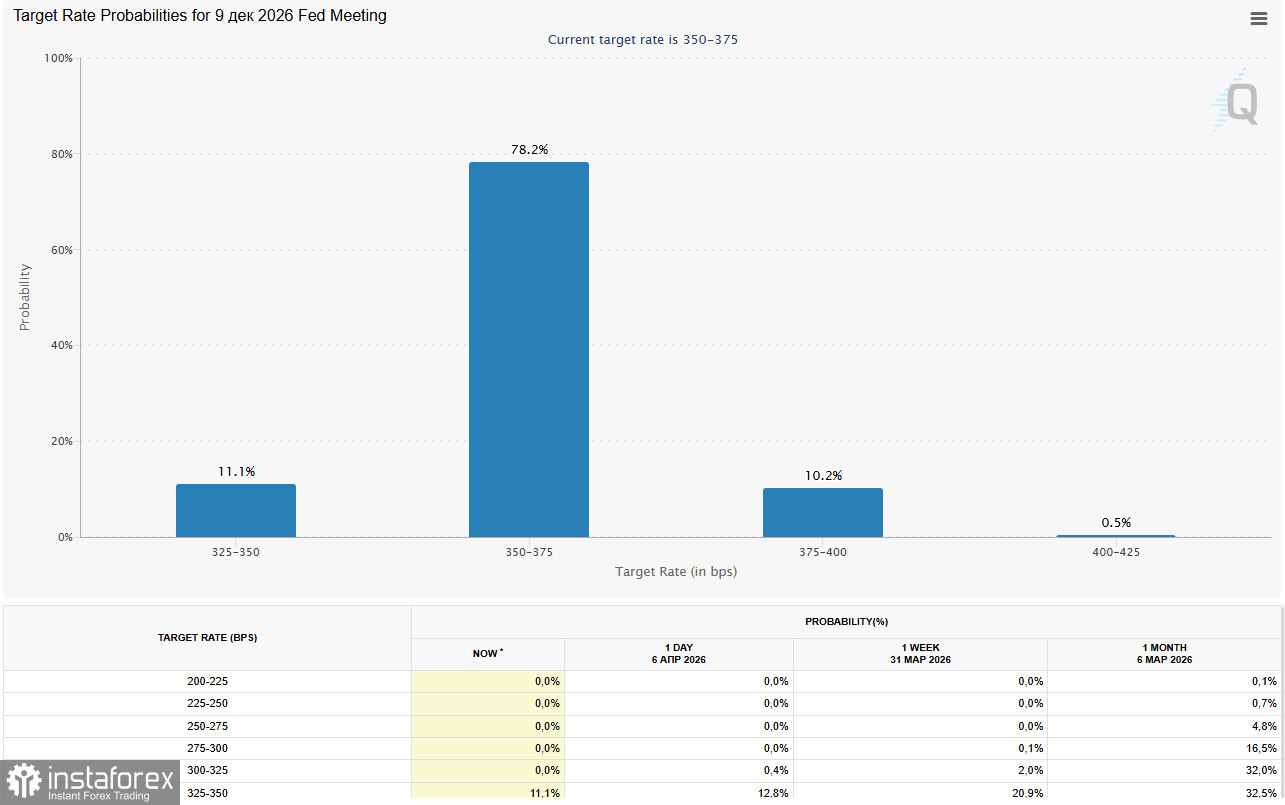
Many economists now rule out rate cuts in 2026 entirely, citing inflation uncertainty.
This is a critical moment for the S&P500. Higher rates pressure equity valuations, especially in the tech sector, while rising energy costs squeeze corporate margins.
Against this backdrop, investors are rotating out of growth stocks into defensive sectors. This is a classic reaction to stagflation risks (high inflation + weak growth). Some equity strategists point to utilities and healthcare as defensive plays. Unlike Energy and Consumer Discretionary, which are directly exposed to oil prices, these sectors are insulated from the energy shock. Moreover, their valuations remain attractive, and earnings growth is supported by demographic trends and infrastructure investment.
Since the start of the year, the S&P500 Energy sector is up about 36%, with nearly 10% of that rally occurring after the Iran conflict began. The question is how much further upside remains.
Contrarian indicator: fear as buy signal?
There is another view. According to an AAII survey, the share of bearish sentiment reached 51.4% last week.
This matters, because since 1987 such a level of pessimism has occurred in only 5% of observations. Historically, this is a powerful contrarian indicator:
- average S&P500 return over the next 6 months after such readings was 10%,
- average return over the next 12 months was 16%.
If the index repeats this historical pattern, it could reach 7,636 by April 2027. Incidentally, this roughly matches Wall Street's median year-end forecast of about 7,650.
Current picture: ceasefire hopes dominate
On Monday, reports emerged that the US, Iran, and a group of regional mediators are discussing terms for a potential ceasefire. US President Donald Trump said talks with Iran are "going well," expressing optimism about a deal before his Tuesday deadline. That news temporarily weakened the dollar as a safe haven and improved sentiment for risk assets.
However, optimism remains cautious. Trump set a Tuesday, 20:00 ET deadline for Iran to open the Strait of Hormuz, threatening to destroy "every bridge and every power plant" in Iran if they did not comply. Iran has already rejected the temporary ceasefire proposal, insisting on a permanent end to the war.
On Friday, when US markets were closed for Easter, the US employment report for March showed a substantial surprise:
- nonfarm payrolls rose by 178,000 (consensus 60,000),
- unemployment fell to 4.3% from 4.4%,
- average hourly earnings slowed to 0.2% m/m (consensus 0.3%).
These data reinforced expectations that the Federal Reserve will keep rates higher for longer.
Geopolitical escalation, combined with budget deficits, could push inflation higher, forcing the Fed to maintain rates at levels well above current market pricing.
Cleveland Fed President Beth Hammack said that while her baseline assumes rates will remain on hold for an extended period, rising inflationary pressure could require further hikes.
Brief technical analysis
Despite the geopolitical storm, the market shows surprising resilience. Last week the S&P 500 bounced off March lows, continuing its recovery from levels near 6,320.00.
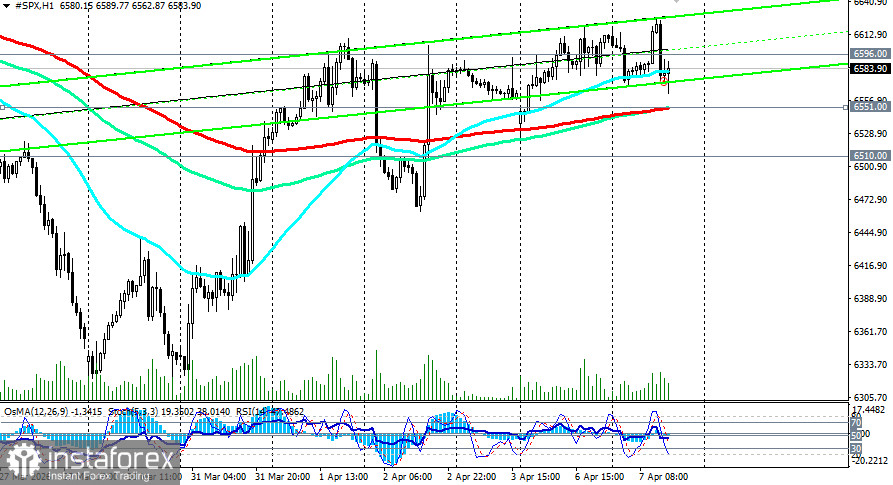
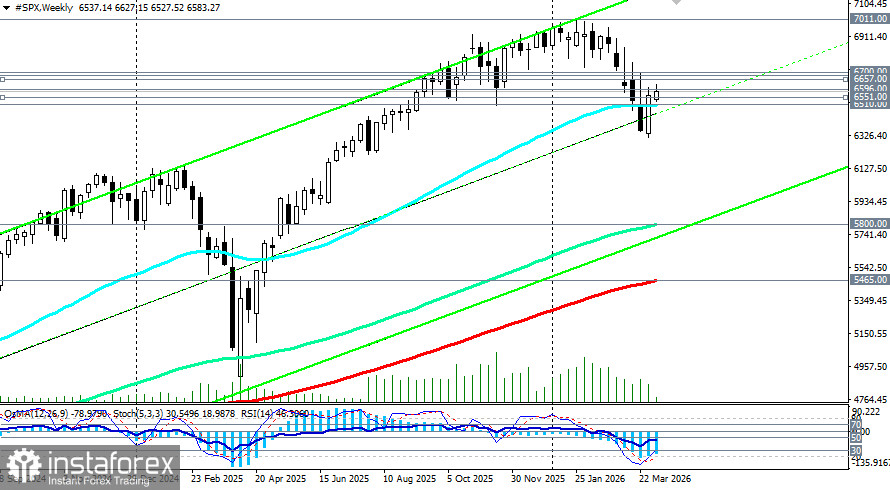
Technically, two scenarios are plausible. If the market holds above the zone 6,551.00 (EMA200 on the 1-hour chart)–6,596.00 (EMA200 on the daily chart), the potential remains for the completion of a fifth wave of growth in H2. If selling intensifies now, this would signal the start of a deep correction toward 5,800.00 (EMA144 on the weekly chart).
Key events of this week
- Tuesday, 20:00 ET (24:00 GMT), Trump's deadline for Iran — key geopolitical trigger,
- Wednesday, publication of the FOMC minutes — signals on the rate path,
- Friday, US CPI data for March — key inflation indicator.
Conclusion
The S&P 500 is at a bifurcation point. Technically, the index still has a chance to resume growth in H2, but geopolitics has temporarily trumped fundamental analysis. The Fed's hands are constrained — strong labor data and rising energy prices compel the regulator to keep rates higher for longer than markets expected.
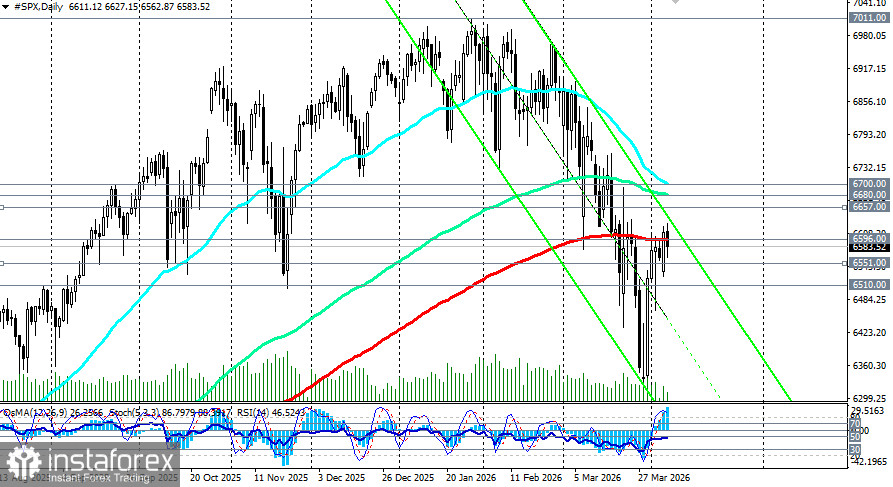
The key zone, 6,550.00–6,660.00, will be the battleground over the coming days. Holding above it preserves prospects for recovery to 6,700.00 and beyond, while a break lower would open the road to 6,000.00 and 5,800.00.
Under any scenario, volatility will remain high. Investors should closely monitor developments around Trump's Tuesday deadline, the FOMC minutes on Wednesday, and Friday's inflation data. Success will favor those who can separate short-term hopes for peace from underlying macroeconomic realities.
*A análise de mercado aqui postada destina-se a aumentar o seu conhecimento, mas não dar instruções para fazer uma negociação.
InstaSpot analytical reviews will make you fully aware of market trends! Being an InstaSpot client, you are provided with a large number of free services for efficient trading.


