


A lenda da equipe InstaSpot!
Lenda! Você acha que isso é retórica bombástica? Mas como devemos chamar um homem que se tornou o primeiro asiático a vencer o campeonato mundial de xadrez aos 18 anos e que se tornou o primeiro grande mestre indiano aos 19? Esse foi o começo de um caminho difícil para o título de campeão do mundo para Viswanathan Anand, o homem que se tornou parte da história do xadrez para sempre. Agora mais uma lenda na equipe InstaSpot!


O Borussia é um dos clubes de futebol com mais títulos da Alemanha, que provou repetidamente aos fãs: o espírito de competição e liderança certamente levará ao sucesso. Negocie da mesma maneira que os profissionais do esporte jogam: com confiança e ativamente. Mantenha o "ritmo" do Borussia FC e esteja na liderança com a InstaSpot!
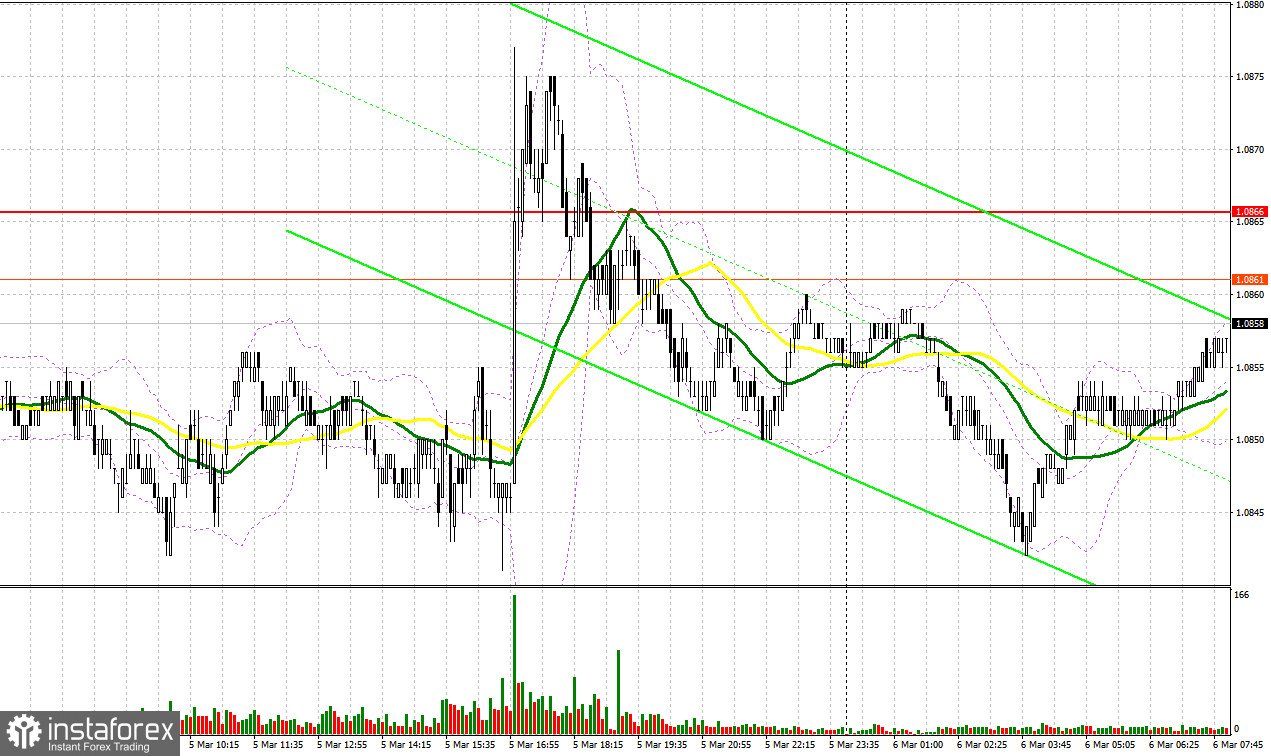
I didn't find any market entry points yesterday. Let's take a look at the 5-minute chart and figure out what happened there. In my previous forecast, I paid attention to the level of 1.0866 and planned to make decisions on entering the market from there. EUR/USD actually rose, but due to the low volatility, it was not possible to test the 1.0866 level. In the afternoon, trading around the level of 1.0866 did not provide any good entry points either.
What is needed to open long positions on EUR/USD
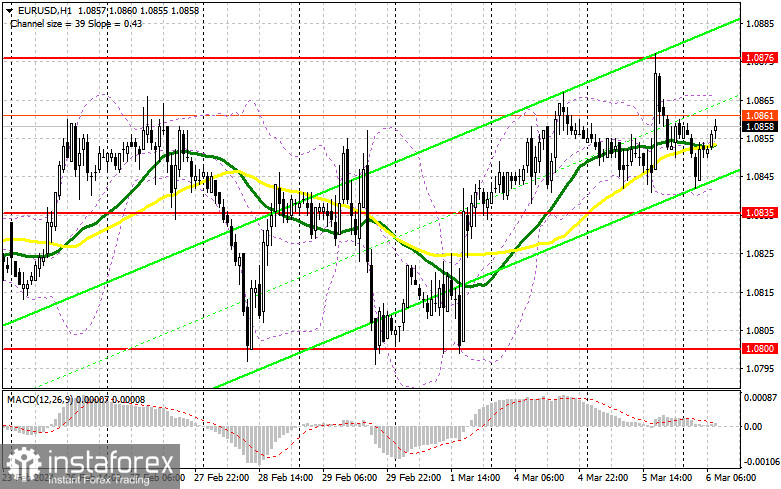
Yesterday, weak U.S. reports exerted pressure on the dollar and supported the euro. The disappointing U.S. Services PMI may affect the Federal Reserve's decision. Today, reports on Germany's Balance of Trade, and EU Retail Sales are eyed. Although they are unlikely to influence the pair's direction ahead of important U.S. data and Fed Chair Jerome Powell's speech. But it is quite possible for the bulls to maintain their advantage, as they make attempts to push the pair above 1.0876, which is unlikely. For this reason, I intend to act on dips only after a false breakout in the area of the nearest support at 1.0835. This will be a proper condition for buying in anticipation of the euro's continued growth to 1.0876. A breakout and a downward test of this range will lead to a new bullish trend, giving a chance to buy during a climb to 1.0905. The farthest target will be the 1.0931 high, where I will take profit. If EUR/USD declines and there is no activity in the area of the lower border of the side channel at 1.0835, the selling pressure on the euro will increase, which will lead to a larger drop with the prospect of testing 1.0800, the lower border of the side channel. I plan to enter the market there only after a false breakout has formed. I will open long positions immediately on a dip from 1.0763, bearing in mind an upward correction of 30-35 pips within the day.
What is needed to open short positions on EUR/USD
The bears came to their senses yesterday, albeit late, as they brought the price back into the channel. Today, only weak eurozone data and unsuccessful consolidation above 1.0876 are a suitable condition for selling with the prospect of testing 1.0835 - the middle of the sideways channel. A breakout and consolidation below this range, as well as an upward retest, will provide another selling point during a slide of the price to 1.0800. As a result, the sellers will regain control over the market. The farthest target will be at least 1.0763, where I will take profits. If EUR/USD moves up in the first half of the day, continuing Friday's trend, and the bears do not show up at 1.0876, the buyers will retain an advantage by getting out of the channel. In this case, I will postpone selling until the test of the next resistance at 1.0905. I will also sell there, but only after unsuccessful consolidation. I plan to open short positions immediately on a rebound from 1.0931, bearing in mind a downward correction of 30-35 pips.
COT report:
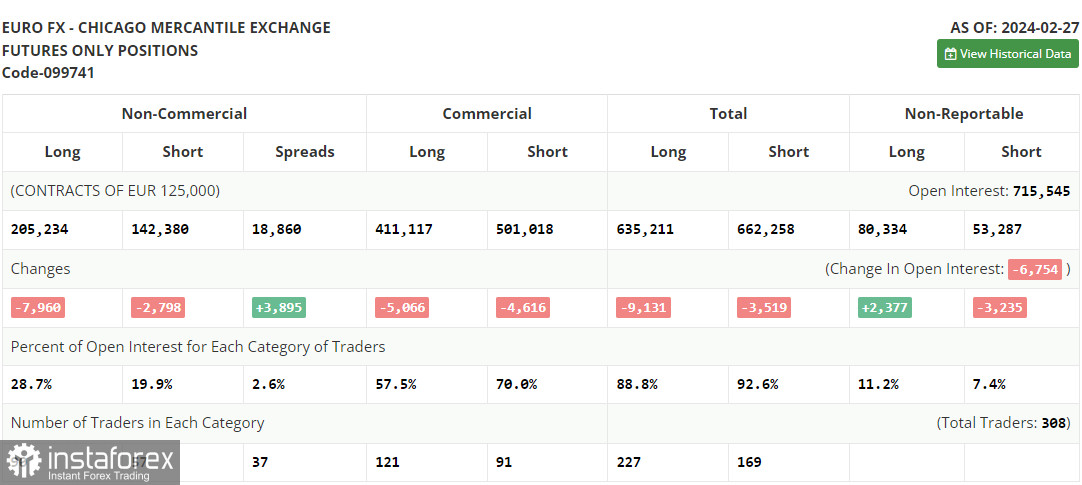
According to the COT report (Commitment of Traders) from February 27, the number of both long and short positions dropped. Apparently, a pause before the meeting of the European Central Bank and the Federal Reserve affects market volatility and the positions of large traders, preventing traders from buying risky assets. With the weak European economy, many expect the European regulator to cut rates sooner than the Fed, limiting the euro's growth. However, the ECB officials are denying this by repeatedly stating that they are not going to cut interest rates, which keeps the market balanced. The COT report indicates that long non-commercial positions fell by 7,960 to 205,234 while short non-commercial positions fell by 2,798 to 142,380. As a result, the spread between long and short positions increased by 3,895.
Indicators' signals
Moving averages
Trading just around the 30- and 50-day moving averages indicates sideways movement.
Note: The period and prices of the moving averages are considered by the analyst on the 1-hour chart and differ from the general definition of classic daily moving averages on the daily chart.
Bollinger Bands
In case EUR/USD goes down, the indicator's lower border near 1.0835 will act as support.
Description of indicators
*A análise de mercado aqui postada destina-se a aumentar o seu conhecimento, mas não dar instruções para fazer uma negociação.
InstaSpot analytical reviews will make you fully aware of market trends! Being an InstaSpot client, you are provided with a large number of free services for efficient trading.


