




Ons team heeft meer dan 7,000,000 handelaren!
Elke dag werken we samen om de handel te verbeteren. We behalen hoge resultaten en gaan verder.
Erkenning door miljoenen handelaren over de hele wereld is de beste waardering voor ons werk! U heeft uw keuze gemaakt en wij zullen er alles aan doen om aan uw verwachtingen te voldoen!
Wij zijn samen een geweldig team!
InstaSpot. Trots om voor je te werken!





Acteur, UFC 6-toernooikampioen en een echte held!
De man die zichzelf heeft gemaakt. De man die onze kant op gaat.
Het geheim achter het succes van Taktarov is een constante beweging naar het doel.
Onthul alle kanten van je talent!
Ontdekken, proberen, falen - maar nooit stoppen!
InstaSpot. Je succesverhaal begint hier!

Those looking for a reason for optimism find it – and the market didn't search long these days, finding two at once. The S&P 500 closed at a record high for the 27th time this year. The formal reason is clear: the July producer price index unexpectedly remained unchanged, even though economists had forecast an increase. A day earlier, the consumer price index delivered a similar surprise. Two straight days of softer inflation data – and markets are now pricing in the probability of a September Fed rate hike at just 32%. A month ago, the talk was of 75%.
Stock index performance
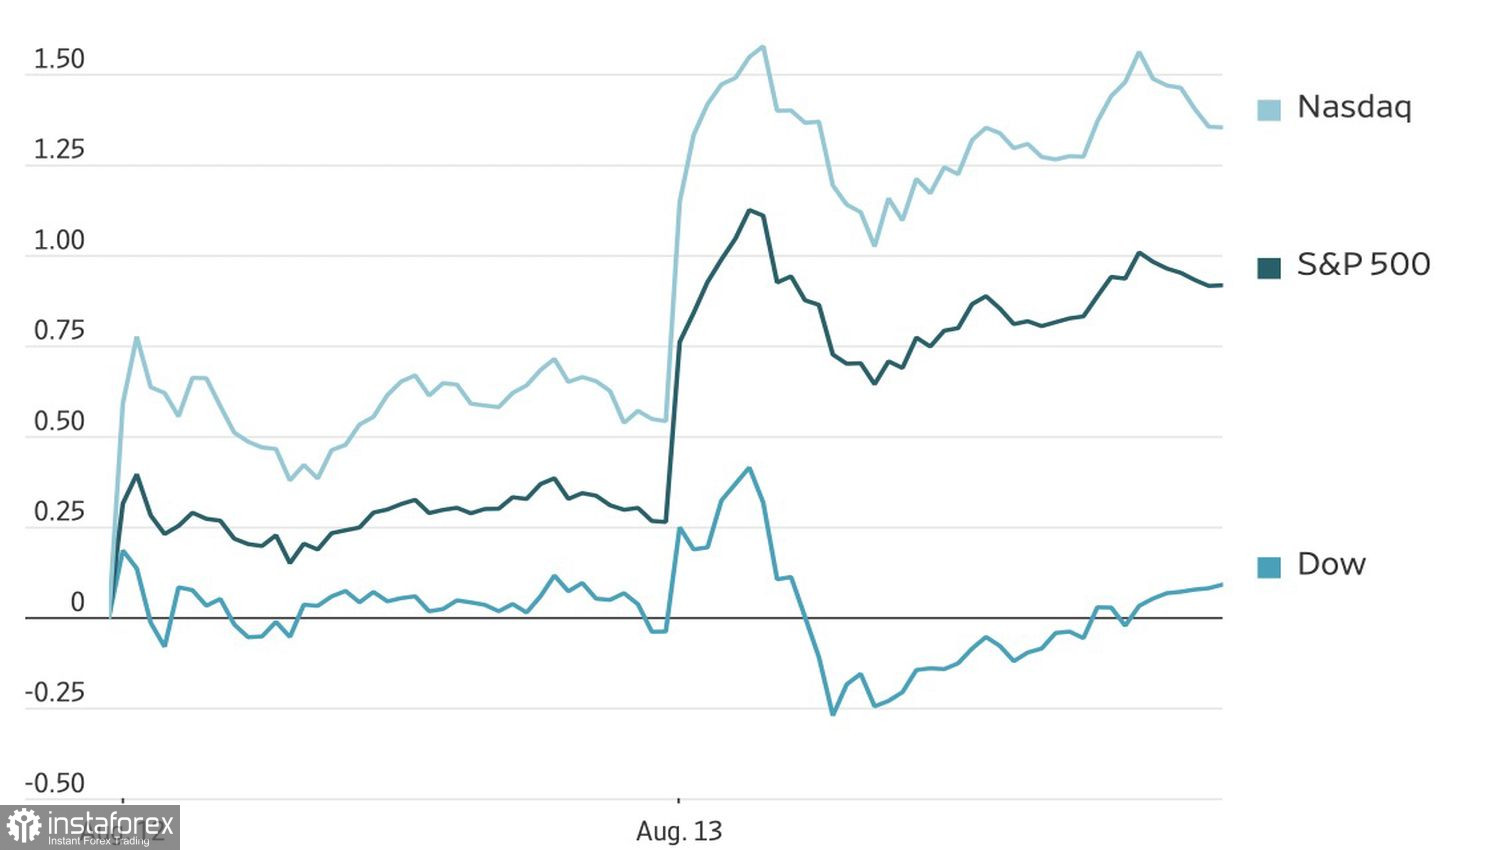
Treasury yields fell, and Wall Street traders took the developments as a long-awaited signal: Kevin Warsh has been given a reprieve, at least until the next meeting. That said, FOMC officials' words have long been met with considerable skepticism, as the market prefers to trust numbers over rhetoric from Washington.
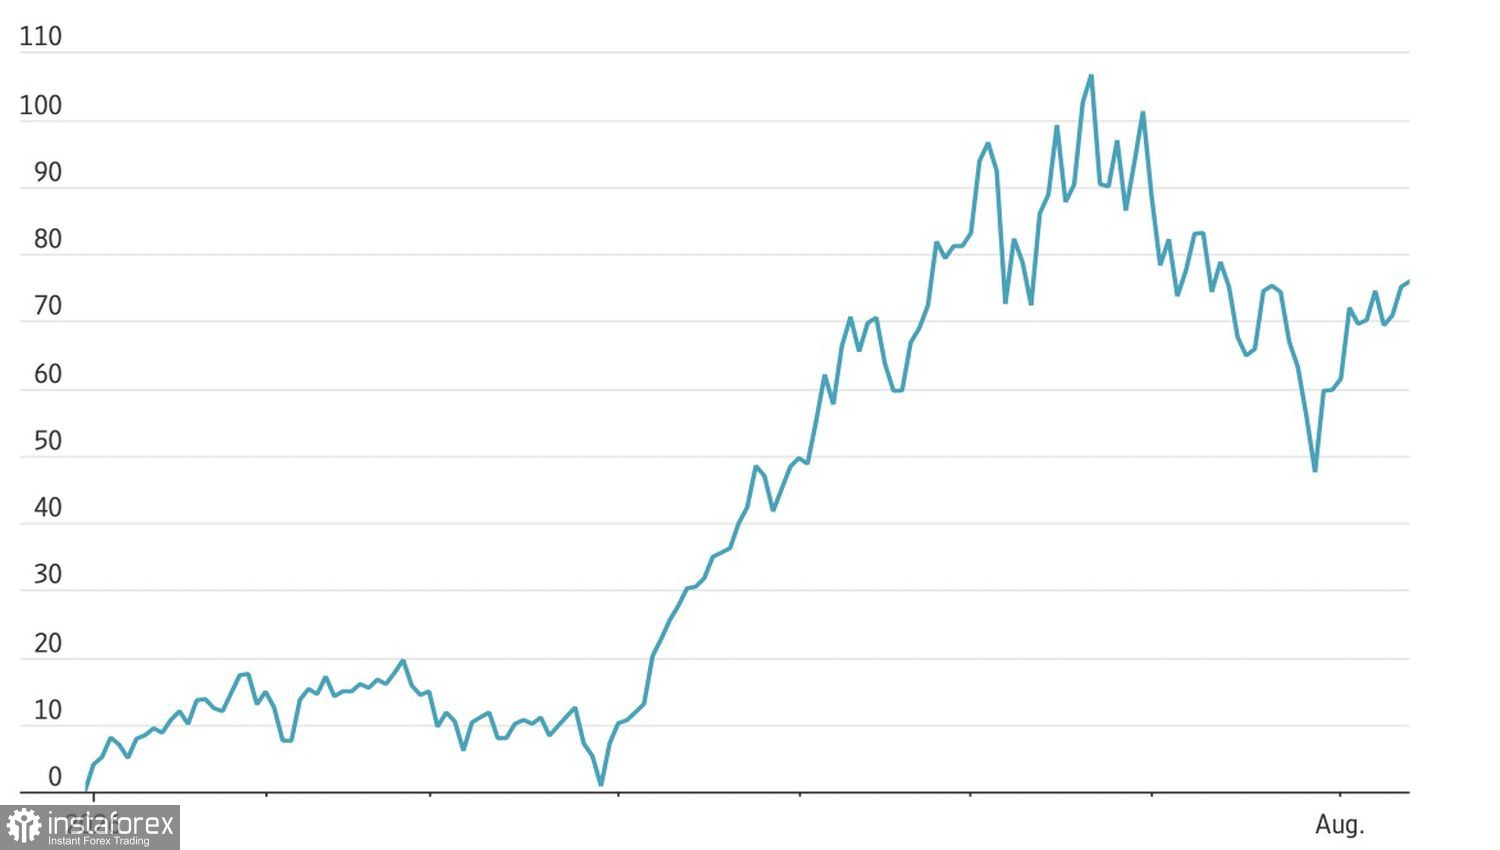
Meanwhile, the PHLX Semiconductor Index has definitively completed a reversal, gaining about 20% from its late-July low and entering a new bull market, with the bear cycle, according to Dow Jones Market Data, proving the shortest since 2020: just 19 trading days versus the typical 54 sessions. History suggests that after such reversals, the index tends to post double-digit gains within six months and significantly more over a full year.
Semiconductor index performance
However, looking beyond the price action, the picture becomes less clear-cut. US real GDP growth has held around a modest 2.1% over the past year, dipping to 1.5% annualized in the second quarter. The stock market, meanwhile, has gone its own way, gaining 13% year-to-date despite tariffs, expensive oil, and disappointing economic data. In effect, the gap between the economy and the stock market is explained less by a bubble than by accelerating corporate profits. According to Bank of America, average earnings growth for S&P 500 companies has accelerated to 13% versus 8% two years earlier. Excluding Amazon and Alphabet, second-quarter profits rose by an impressive 32%, according to FactSet calculations.
Thus, it's not just about artificial intelligence and demand for cloud storage and chips, although that theme remains the main engine of the rally. Demand for goods and services is steadily rising across the broader economy, not just among AI-linked companies. The risks here are roughly balanced: either the market is indeed ahead of reality, and the economy will eventually catch up, or the stock market has spotted an acceleration not yet visible in official statistics.
Has the market disconnected from reality – or has reality simply not yet caught up with it?
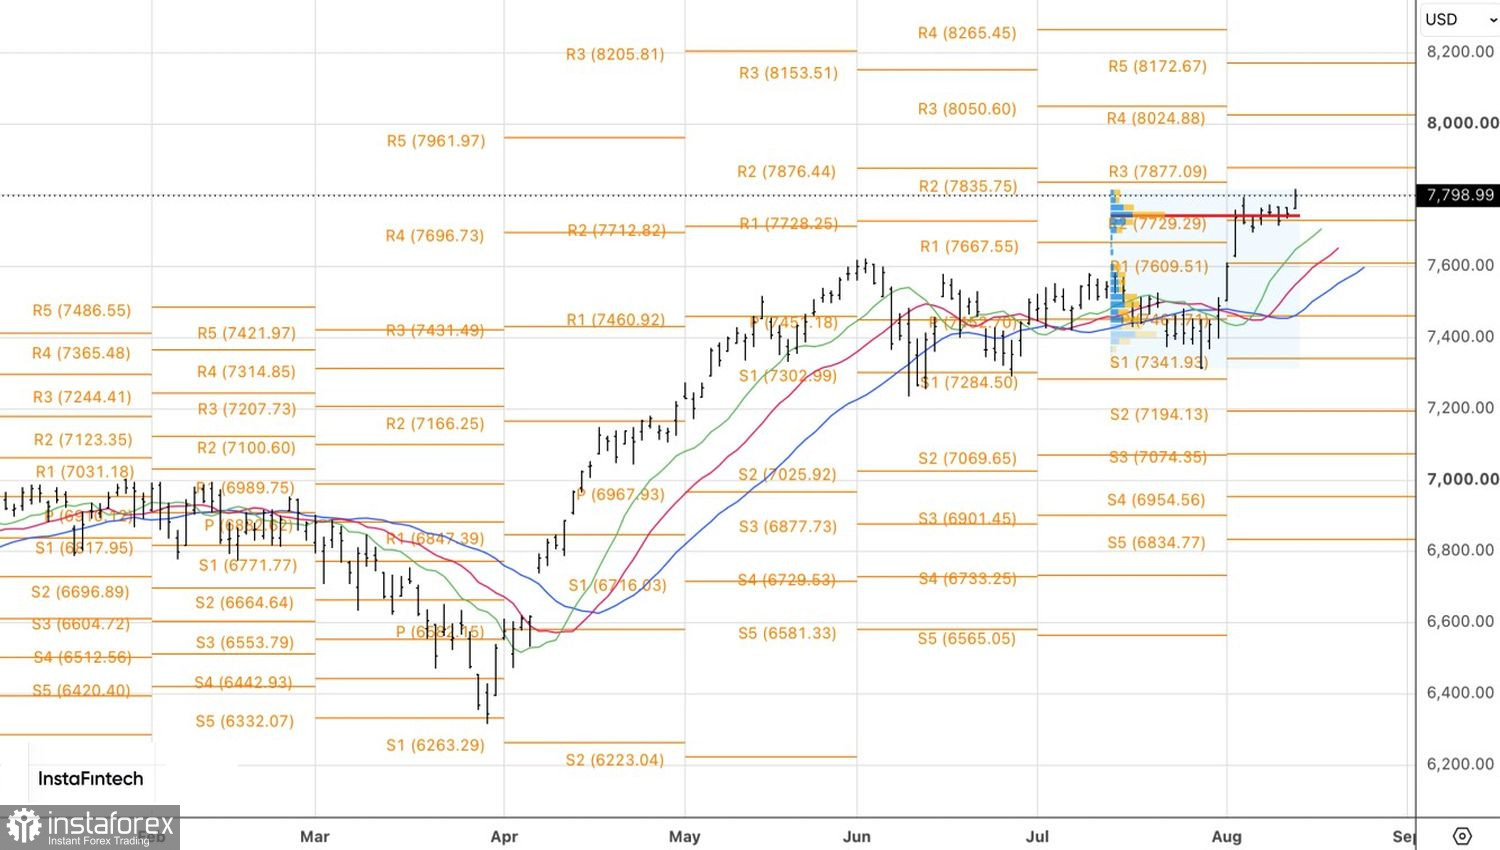
Technically, on the daily chart, the S&P 500 broke above the consolidation range of 7,710-7,770, allowing long positions to be established. These should only be reversed to shorts if the spike and ledge pattern transforms into a false breakout, which would require a fall below 7,740.
*The market analysis posted here is meant to increase your awareness, but not to give instructions to make a trade.
InstaSpot analytical reviews will make you fully aware of market trends! Being an InstaSpot client, you are provided with a large number of free services for efficient trading.


