




The legend in the InstaSpot team!
Legend! You think that's bombastic rhetoric? But how should we call a man, who became the first Asian to win the junior world chess championship at 18 and who became the first Indian Grandmaster at 19? That was the start of a hard path to the World Champion title for Viswanathan Anand, the man who became a part of history of chess forever. Now one more legend in the InstaSpot team!





Borussia is one of the most titled football clubs in Germany, which has repeatedly proved to fans: the spirit of competition and leadership will certainly lead to success. Trade in the same way that sports professionals play the game: confidently and actively. Keep a "pass" from Borussia FC and be in the lead with InstaSpot!

Bitcoin and Ethereum declined during the first half of the day, but overall, trading remains within an upward corrective channel.

Meanwhile, the BVIV index, which tracks 30-day implied Bitcoin volatility on an annualized basis, also declined. The indicator fell to 35.59%, its lowest level since September. This indicator serves as a cryptocurrency equivalent of the VIX in the traditional stock market: the higher the demand for options protection against price fluctuations, the higher the index. Therefore, its sharp decline indicates a fading of fear rather than optimism as such. For comparison, BVIV rose above 90% in early February, when Bitcoin plunged from $90,000 to almost $60,000 and traders massively bought options to hedge against sharp price swings.
The current calm can be explained by an imbalance between supply and demand in the options market. As long as the price remains firmly within the established range, interest in so-called directional options trading through call or put options on a significant price move in either direction has simply disappeared. Traders have stopped buying protection because they see no reason to position for a sharp surge or collapse, and this decline in demand has directly contributed to the decrease in BVIV.
A structural shift in the behavior of large holders is also playing a key role in suppressing volatility. The effect is further reinforced by the typical mid-year summer lull. Due to reduced trader activity during the holiday season, realized volatility—the actual amplitude of price movements—has declined, which is also putting downward pressure on volatility.
As for short-term trading, the strategy and conditions are outlined below.
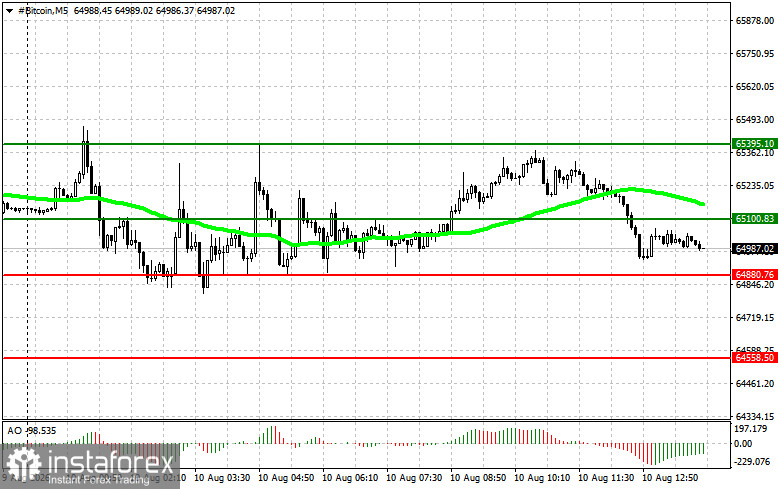
Scenario #1: Today, I will buy Bitcoin when the entry point is reached around $65,100, targeting a rise to $65,400. Around $65,400, I will close the long position and immediately look for a short position on a rebound. Before buying a breakout, it is necessary to make sure that the 50-day moving average is below the current price and that the Awesome Oscillator is above zero.
Scenario #2: Bitcoin can be bought from the lower boundary at $64,800 if there is no market reaction to a break below this level, followed by a return toward $65,100 and $65,400.
Scenario #1: Today, I will sell Bitcoin when the entry point is reached around $64,800, targeting a decline to $64,500. Around $64,500, I will close the short position and immediately look for a long position on a rebound. Before selling a breakout, it is necessary to make sure that the 50-day moving average is above the current price and that the Awesome Oscillator is below zero.
Scenario #2: Bitcoin can be sold from the upper boundary at $65,100 if there is no market reaction to a break above this level, followed by a return toward $64,800 and $64,500.
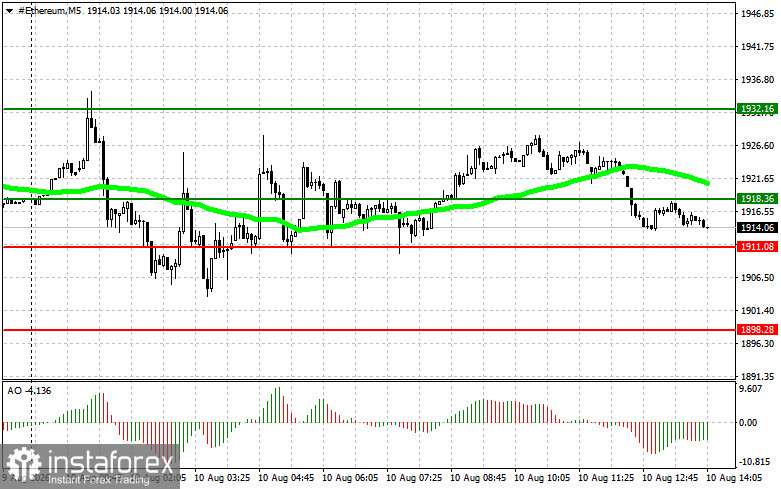
Scenario #1: Today, I will buy Ethereum when the entry point is reached around $1,918, targeting a rise to $1,932. Around $1,932, I will close the long position and immediately look for a short position on a rebound. Before buying a breakout, it is necessary to make sure that the 50-day moving average is below the current price and that the Awesome Oscillator is above zero.
Scenario #2: Ethereum can be bought from the lower boundary at $1,911 if there is no market reaction to a break below this level, followed by a return toward $1,918 and $1,932.
Scenario #1: Today, I will sell Ethereum when the entry point is reached around $1,911, targeting a decline to $1,898. Around $1,898, I will close the short position and immediately look for a long position on a rebound. Before selling a breakout, it is necessary to make sure that the 50-day moving average is above the current price and that the Awesome Oscillator is below zero.
Scenario #2: Ethereum can be sold from the upper boundary at $1,918 if there is no market reaction to a break above this level, followed by a return toward $1,911 and $1,898.
*The market analysis posted here is meant to increase your awareness, but not to give instructions to make a trade.
InstaSpot analytical reviews will make you fully aware of market trends! Being an InstaSpot client, you are provided with a large number of free services for efficient trading.


