




Ons team heeft meer dan 7,000,000 handelaren!
Elke dag werken we samen om de handel te verbeteren. We behalen hoge resultaten en gaan verder.
Erkenning door miljoenen handelaren over de hele wereld is de beste waardering voor ons werk! U heeft uw keuze gemaakt en wij zullen er alles aan doen om aan uw verwachtingen te voldoen!
Wij zijn samen een geweldig team!
InstaSpot. Trots om voor je te werken!





Acteur, UFC 6-toernooikampioen en een echte held!
De man die zichzelf heeft gemaakt. De man die onze kant op gaat.
Het geheim achter het succes van Taktarov is een constante beweging naar het doel.
Onthul alle kanten van je talent!
Ontdekken, proberen, falen - maar nooit stoppen!
InstaSpot. Je succesverhaal begint hier!

People tend not to act until the thunder strikes. And investors had long turned a blind eye to the smouldering US–Iran conflict until fresh clashes around the Strait of Hormuz forced a reckoning. Oil surged, Treasury yields followed, and the S&P 500's two-day rally finally stumbled.
Daily S&P 500 dynamics
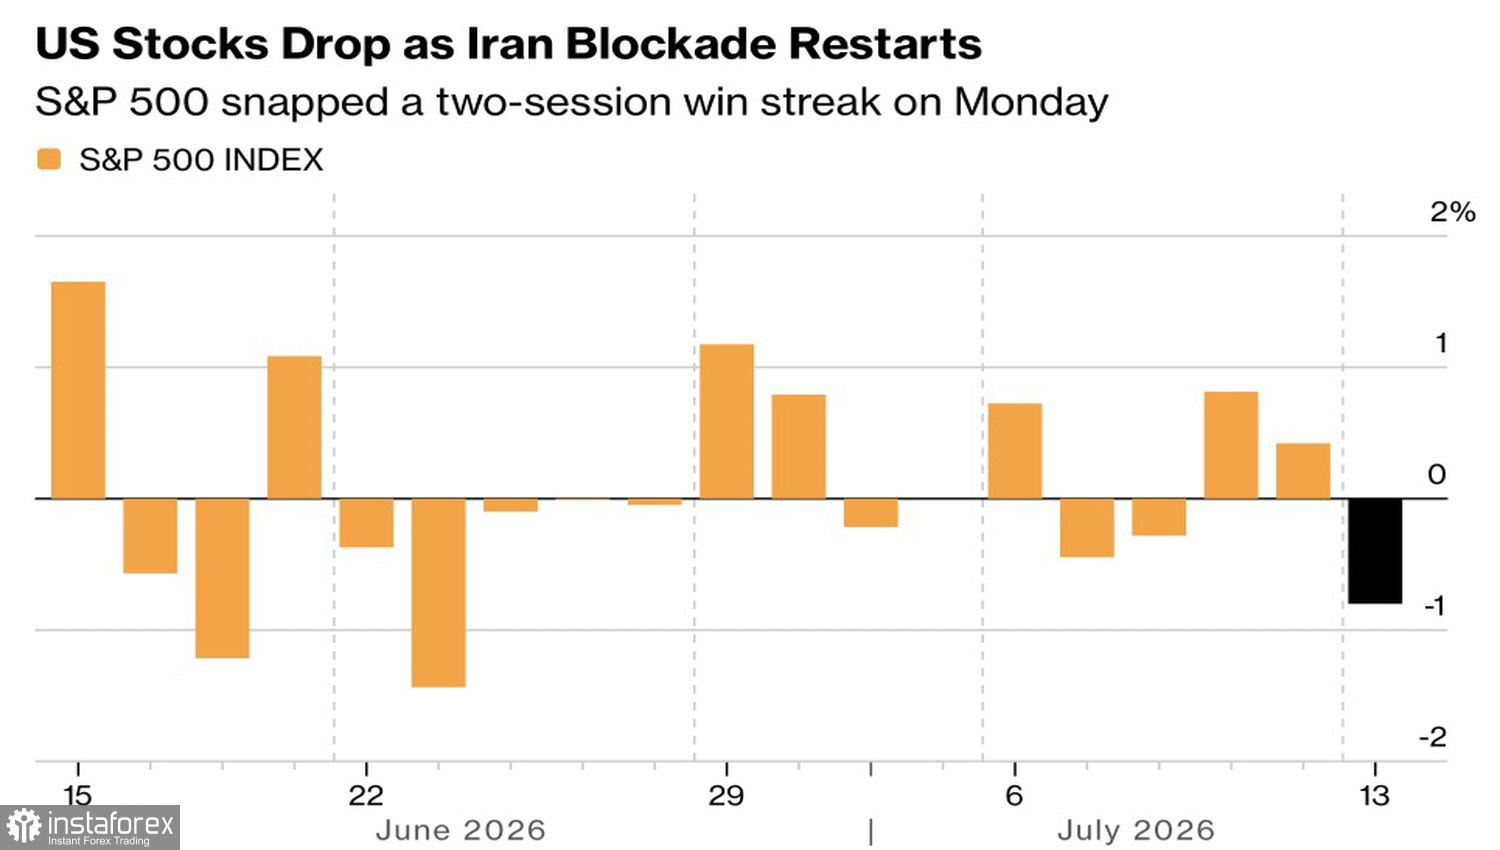
That said, this is not a crash. The broad market has felt resilient all year thanks to the AI boom and strength in energy and industrials. The pain was concentrated in tech: the information technology sector became the S&P 500's main laggard, and chipmakers led the sell-off. Investors are increasingly asking whether the colossal AI capex is justified in an environment of rising global rates.
Earnings, however, remain in good shape. Morgan Stanley estimates the equal-weighted S&P 500 is showing EPS growth of more than 10%, the best print since the post-pandemic rebound. The bank continues to revise up forecasts for consumer and transport sectors, which are closely tied to economic momentum. FactSet goes further: S&P 500 earnings could rise from $275 per share in 2025 to $341 in 2026, marking a 24% gain. The only question is whether investors believe these numbers or are merely rotating capital out of three-digit winners into less heated names.
Equal-weighted index vs S&P 500 dynamics
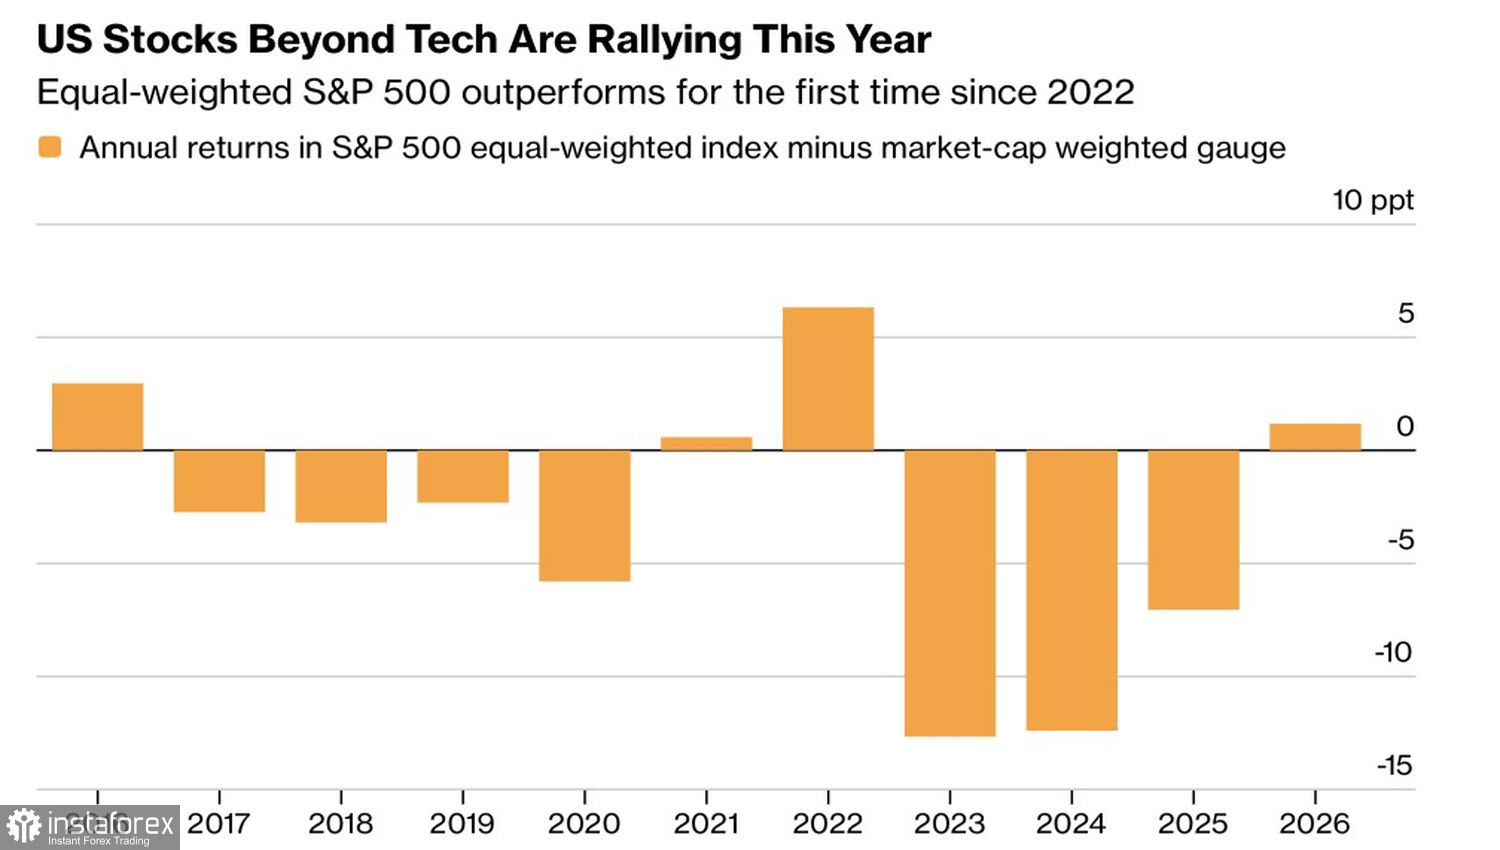
Meanwhile, the Middle East escalation has revived Fed-tightening talk. CME Group data showed that the odds of a July rate rise jumped to 42% from 18% in early July, and the probability of two tightening moves by year-end rose to 56% from 34%. Silence from new Fed Chair Kevin Warsh does little to clarify the outlook. JPMorgan warns that if he continues to avoid clear signals, other FOMC members may take the initiative.
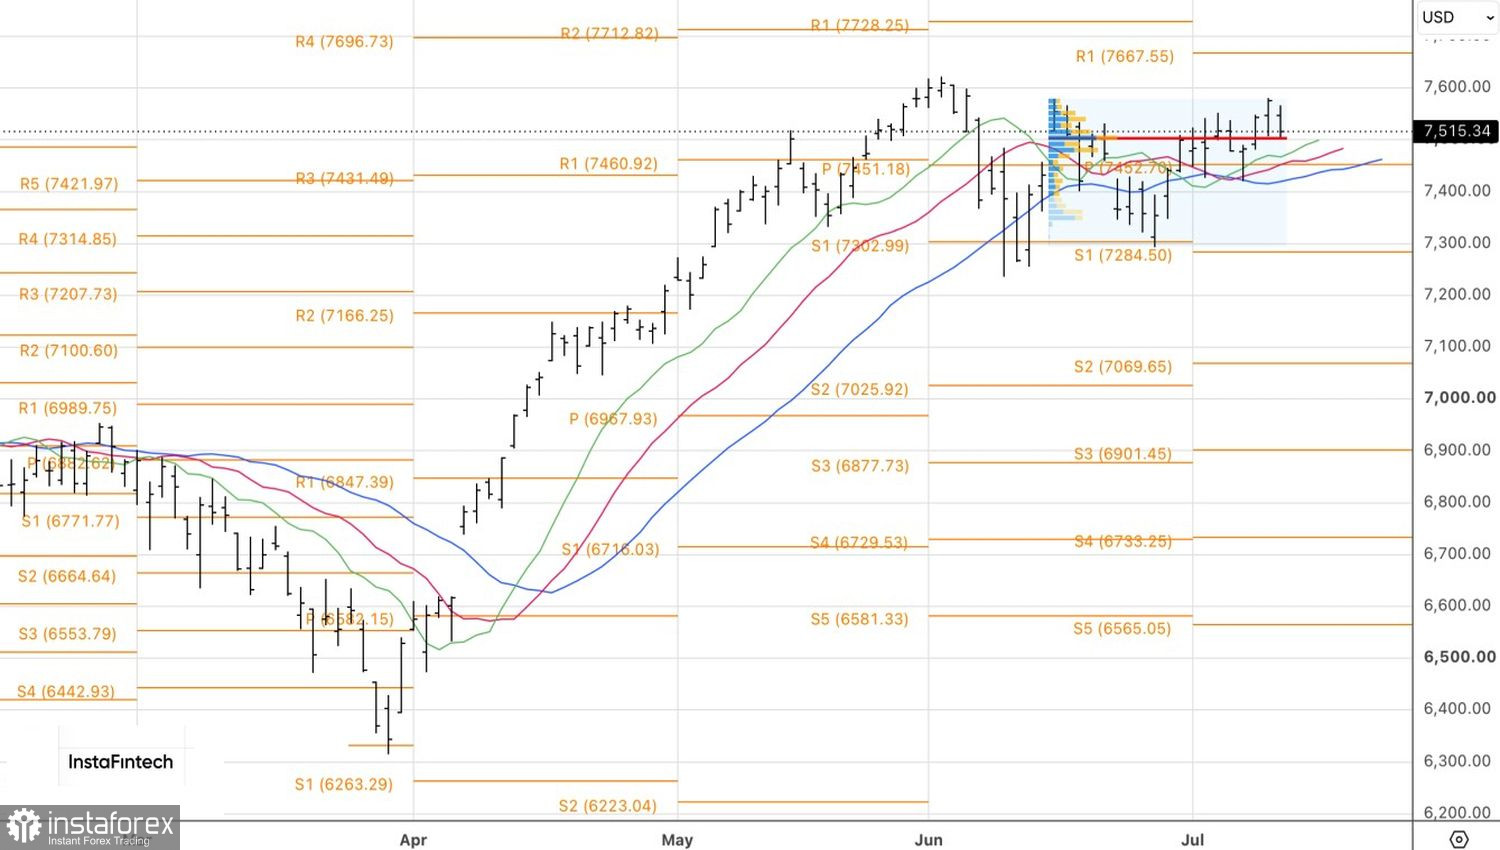
The week to July 17 promises to be a trial. Investors must digest June CPI, PPI, consumer sentiment data, and the start of earnings season — with JP Morgan Chase and Goldman Sachs reporting early. The US equity market has lived too long on optimistic narratives rather than hard data. Is it ready to face reality?
Technically, the daily chart shows that the S&P 500 has returned to fair value near 7,505. That level is now a red line for the broad index. A rebound from it would be a reason to add long positions. Conversely, a decisive break and hold below that level would be a cue for profit-taking, a trend reversal, and a switch to short positions.
*The market analysis posted here is meant to increase your awareness, but not to give instructions to make a trade.
InstaSpot analytical reviews will make you fully aware of market trends! Being an InstaSpot client, you are provided with a large number of free services for efficient trading.


