


The legend in the InstaSpot team!
Legend! You think that's bombastic rhetoric? But how should we call a man, who became the first Asian to win the junior world chess championship at 18 and who became the first Indian Grandmaster at 19? That was the start of a hard path to the World Champion title for Viswanathan Anand, the man who became a part of history of chess forever. Now one more legend in the InstaSpot team!


Borussia is one of the most titled football clubs in Germany, which has repeatedly proved to fans: the spirit of competition and leadership will certainly lead to success. Trade in the same way that sports professionals play the game: confidently and actively. Keep a "pass" from Borussia FC and be in the lead with InstaSpot!

The EUR/USD currency pair traded with low volatility on Tuesday, with no significant decrease. Recall that over the past five days, the US dollar has been rising quite actively, and the trend has even changed to a downward one after the ascending trend line was breached. But was such growth justified? In terms of technical factors, yes. Corrections have always been an integral part of a trend. In terms of macroeconomic factors, to some extent, yes, because recent US reports have indeed brought positive news. However, from a fundamental perspective, no. Nothing has changed for the dollar on a global scale. Yet even global fundamental factors cannot pressure the dollar every day. Therefore, within the framework of the upward trend, we saw a technical correction. This week, traders will need to understand how long the "shutdown" will last, whether the US will strike Iran, and the state of the US labor market. These topics define trader sentiment and the direction of the pair's movement.
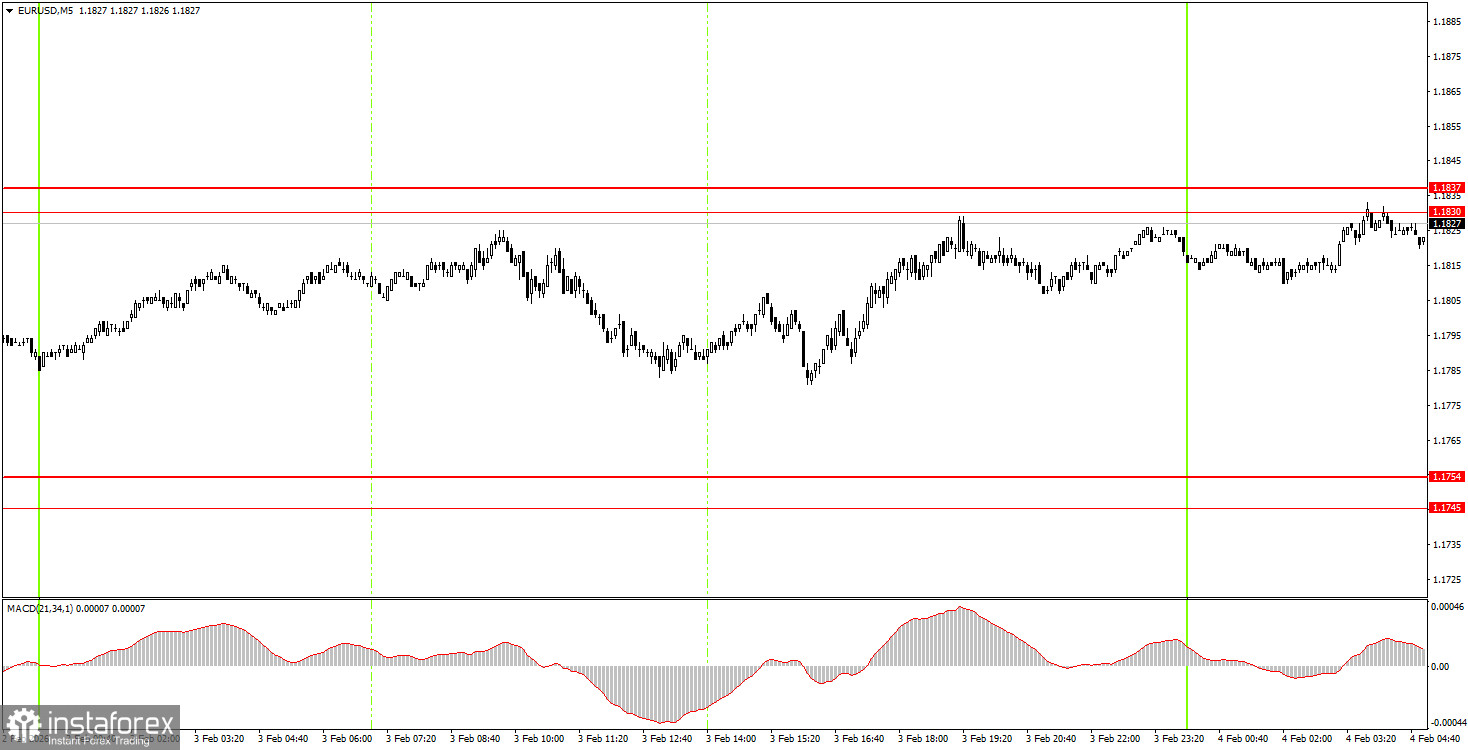
On the 5-minute timeframe, no trading signals were formed on Tuesday. In the evening, the price nearly worked out the area of 1.1830-1.1837, but by that time, it was unlikely worth opening new trades. Today, beginner traders can trade from this area, as the price is situated right around it.
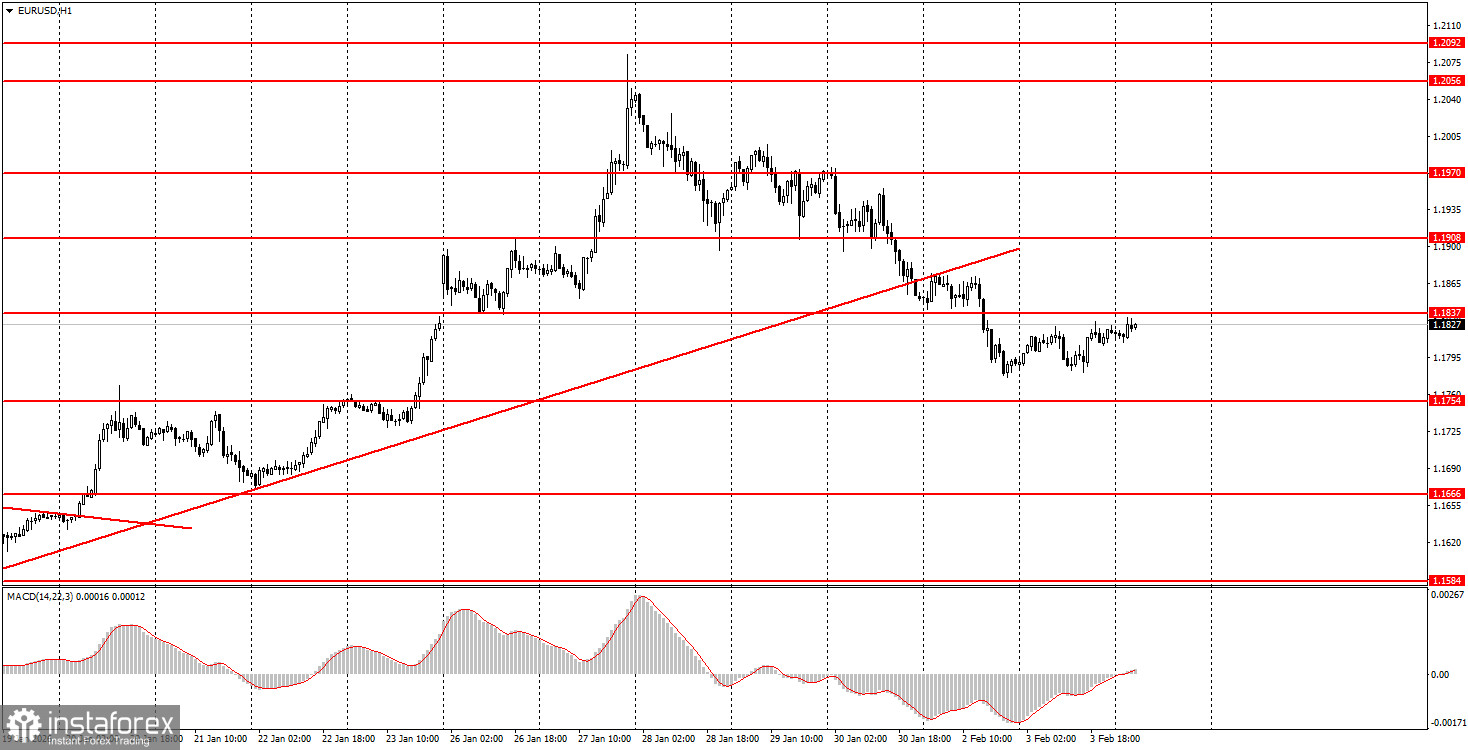
On the hourly timeframe, the downward correction continues. Recall that the flat phase lasting 7 months can be considered completed. If so, a long-term upward trend has been restored at the beginning of 2026. Therefore, we expect a new decline for the dollar. The overall fundamental background remains very challenging for the US currency, so we firmly support further upward movement for the euro.
On Wednesday, beginner traders may open short positions if there is a rebound from the area of 1.1830-1.1837, targeting 1.1745-1.1754. A price consolidation above the 1.1830-1.1837 area will allow for long positions with a target at 1.1908.
On the 5-minute timeframe, levels to consider include 1.1354-1.1363, 1.1413, 1.1455-1.1474, 1.1527-1.1531, 1.1550, 1.1584-1.1591, 1.1655-1.1666, 1.1745-1.1754, 1.1830-1.1837, 1.1908, 1.1970-1.1988, 1.2044-1.2056, 1.2092-1.2104. Today, beginner traders should pay attention to three important reports: the Eurozone inflation report, as well as the ADP and ISM reports for the US services sector. Inflation in the EU may slow to levels at which the ECB will have to contemplate resuming rate cuts. The American reports are important in their own right.
*The market analysis posted here is meant to increase your awareness, but not to give instructions to make a trade.
InstaSpot analytical reviews will make you fully aware of market trends! Being an InstaSpot client, you are provided with a large number of free services for efficient trading.


